Common visual representations of data were invented:
Line chart: ~1700
Bar chart: ~1780
Scatterplot: ~1785
Paralell Coordinates: ~1885
Tree diagrams: ~1150
Flow maps: ~1859
Tree maps: ~1992
Scatterplot:

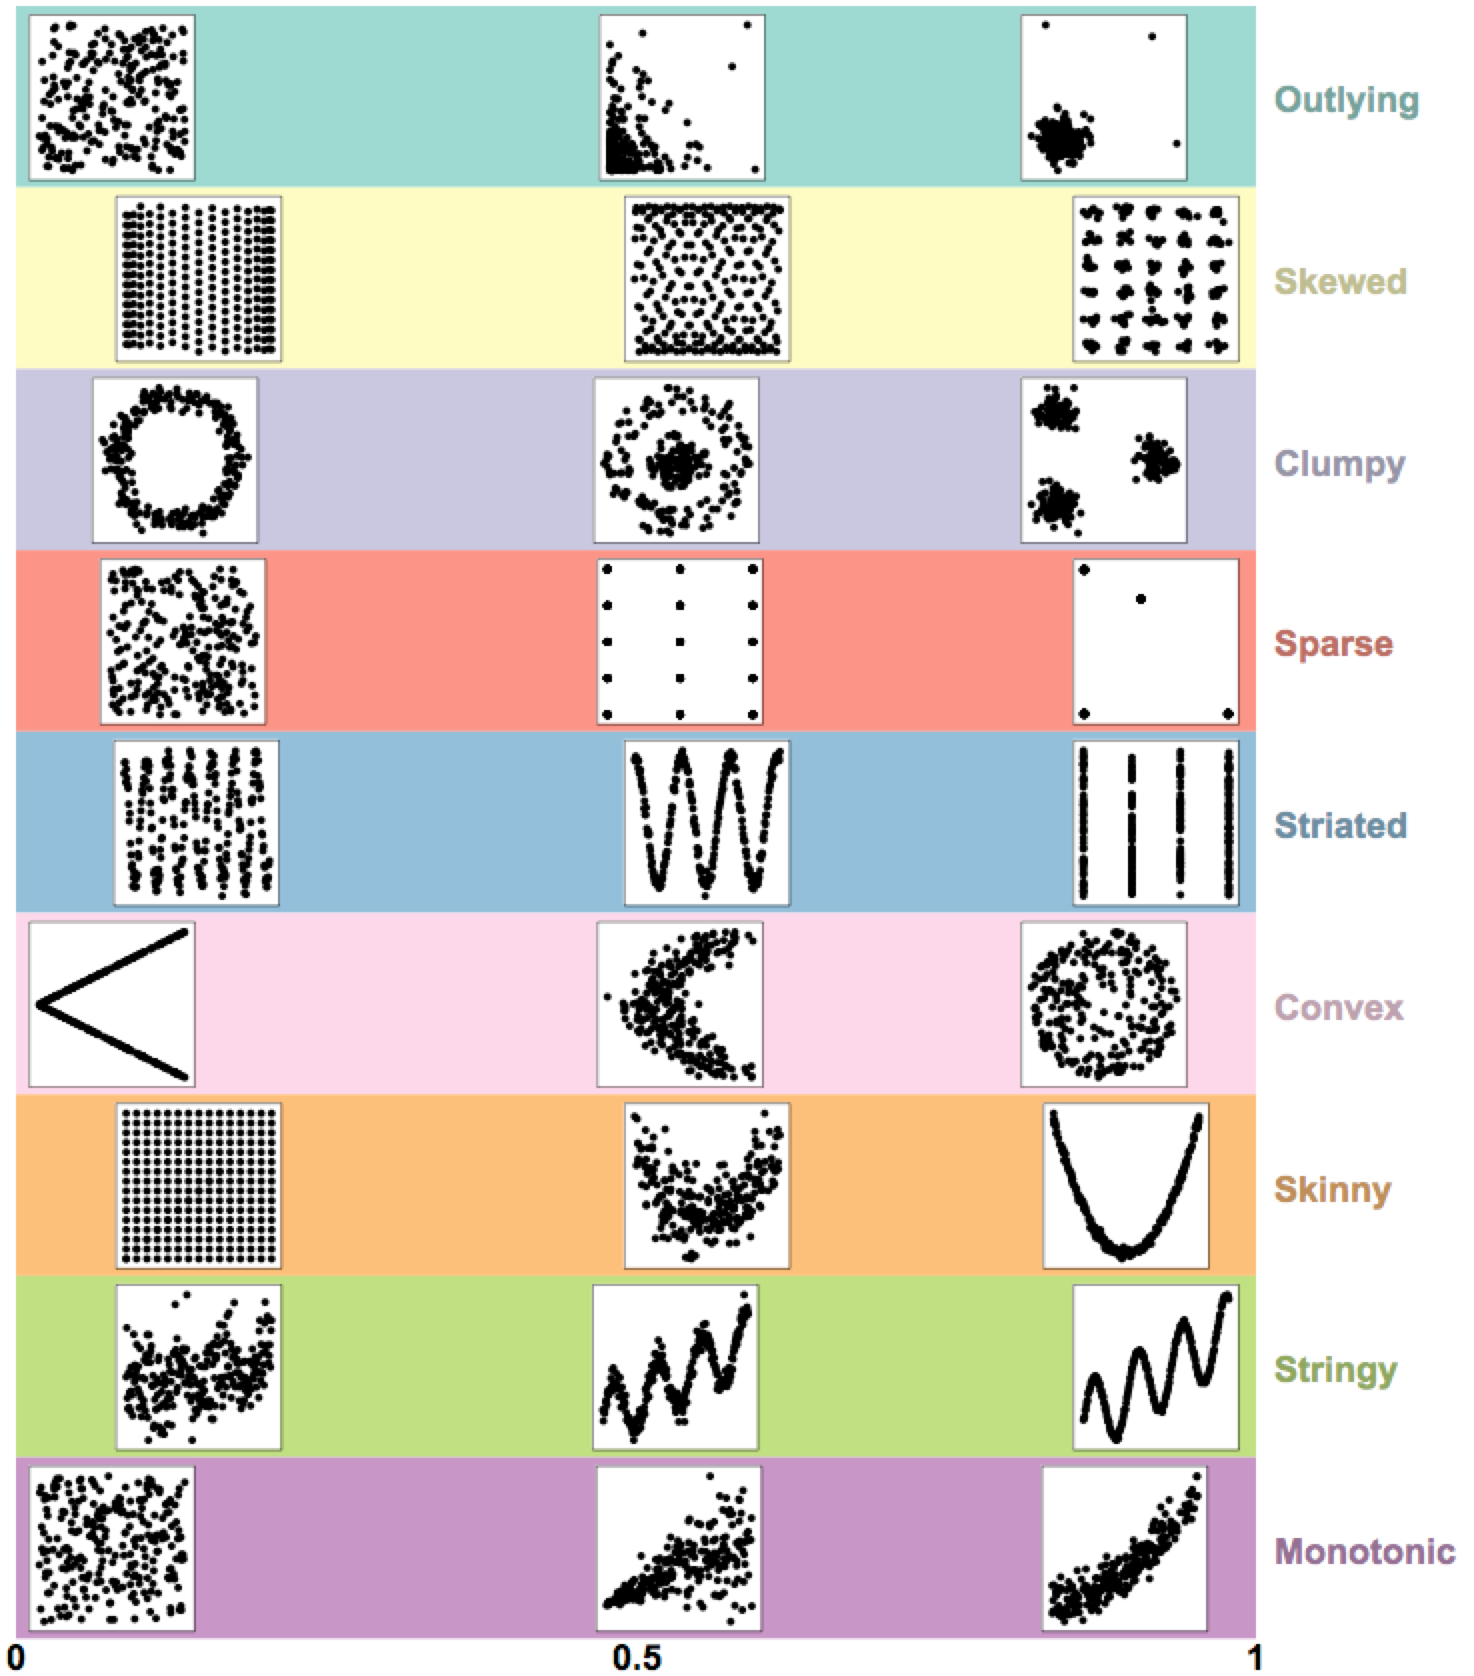
Scagnostics:
Visual features help us to characterize 2D scatterplots: Visual analytics?
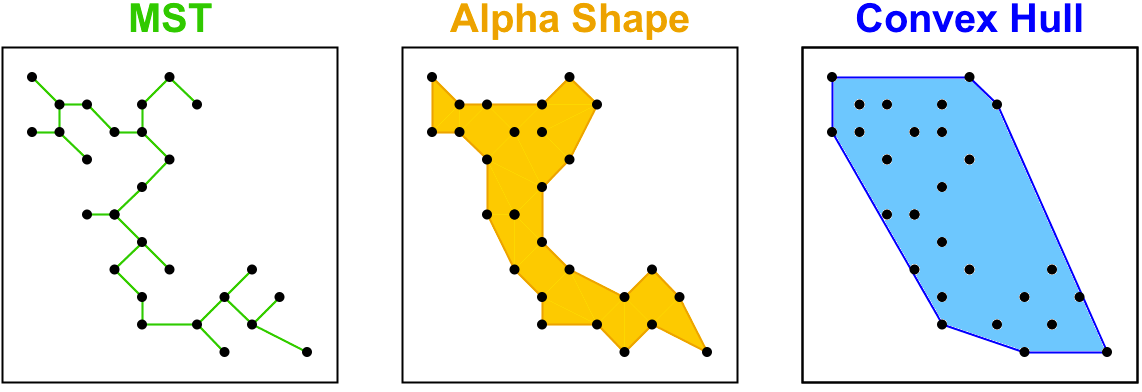
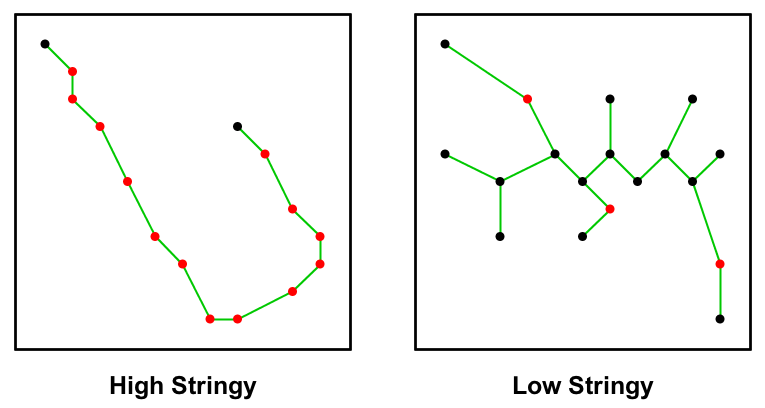
Scagnostics are computed on on three geometric graphs
A Stringy shape is a skinny shape with no branches
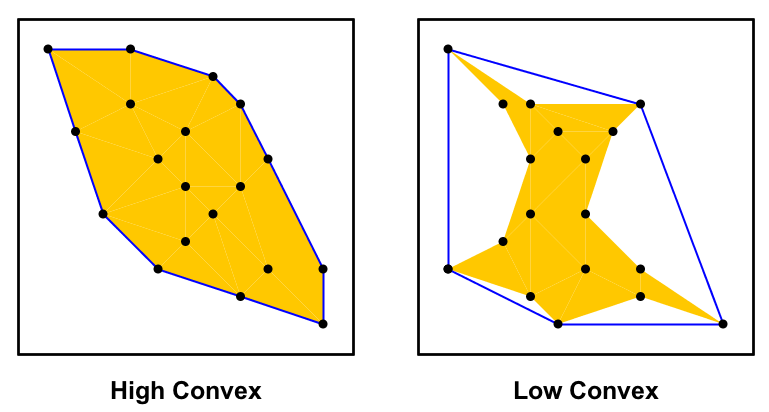
Computing Convex: The ratio of the area of the alpha hull and the convex hull
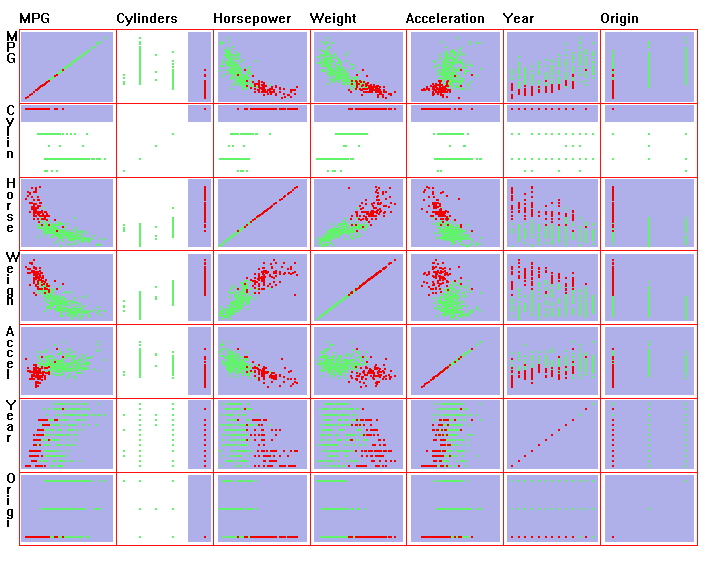
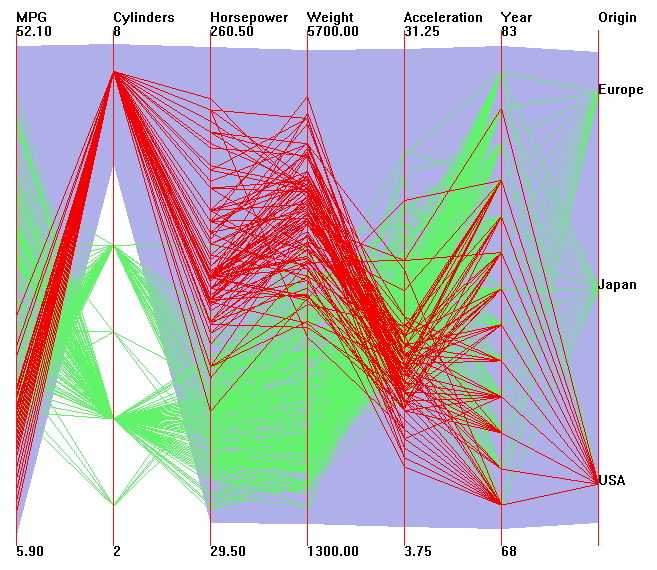
Scatterplot Matrix vs. Paralell Coordinates:


XmdvTool:
XmdvTool is freely vailable at: http://davis.wpi.edu/xmdv/
https://vimeo.com/76067740
D3:
Scatterplot Matrix: http://mbostock.github.io/d3/talk/20111116/iris-splom.html
Paralell Coordinates: https://bl.ocks.org/jasondavies/1341281
Paralell Coordinates: Large Nutrient dataset http://bl.ocks.org/syntagmatic/3150059
Papers:
Paralell Coordinates: An Edge-Bundling Layout for Interactive Parallel Coordinates
Paralell Coordinates: An Illustrative Parallel Coordinates
Paralell Coordinates: Stacking Graphic Elements to Avoid Over-Plotting
Paralell Coordinates: Visual Clustering in Parallel Coordinates
Paralell Coordinates: Continuous Parallel Coordinates
Paralell Coordinates: State of the Art of Parallel Coordinates
© Last revised: March 26th, 2019