Entry Name:"TTU-Dang-MC3"
VAST Challenge
2018
Mini-Challenge 3
Team Members:
Tommy
Dang, IDV Lab, Texas Tech University, tommy.dang@ttu.edu,
PRIMARY
Van Vung Pham, IDV Lab, Texas Tech University, vung.pham@ttu.edu, Student
Student Team: NO
Tools Used:
HTML, CSS, JS
d3.js, cola.js
Approximately how
many hours were spent working on this submission in total?
280
May we post your
submission in the Visual Analytics Benchmark Repository after VAST Challenge
2018 is complete? YES
Video
Questions
1.
Using the four large Kasios International data sets, combine the different sources to create a single picture of the company. Characterize changes in the company over time. According to the company's communications and purchase habits, is the company growing?
Figure 1 shows the changes in the company over time. The company's communications (calls, emails, and meetings) are pretty stable while the number of purchases (in red) has increased significantly over the past 2 years (as expanded to show futher detail in Figure 2). Therefore, the company is growing.
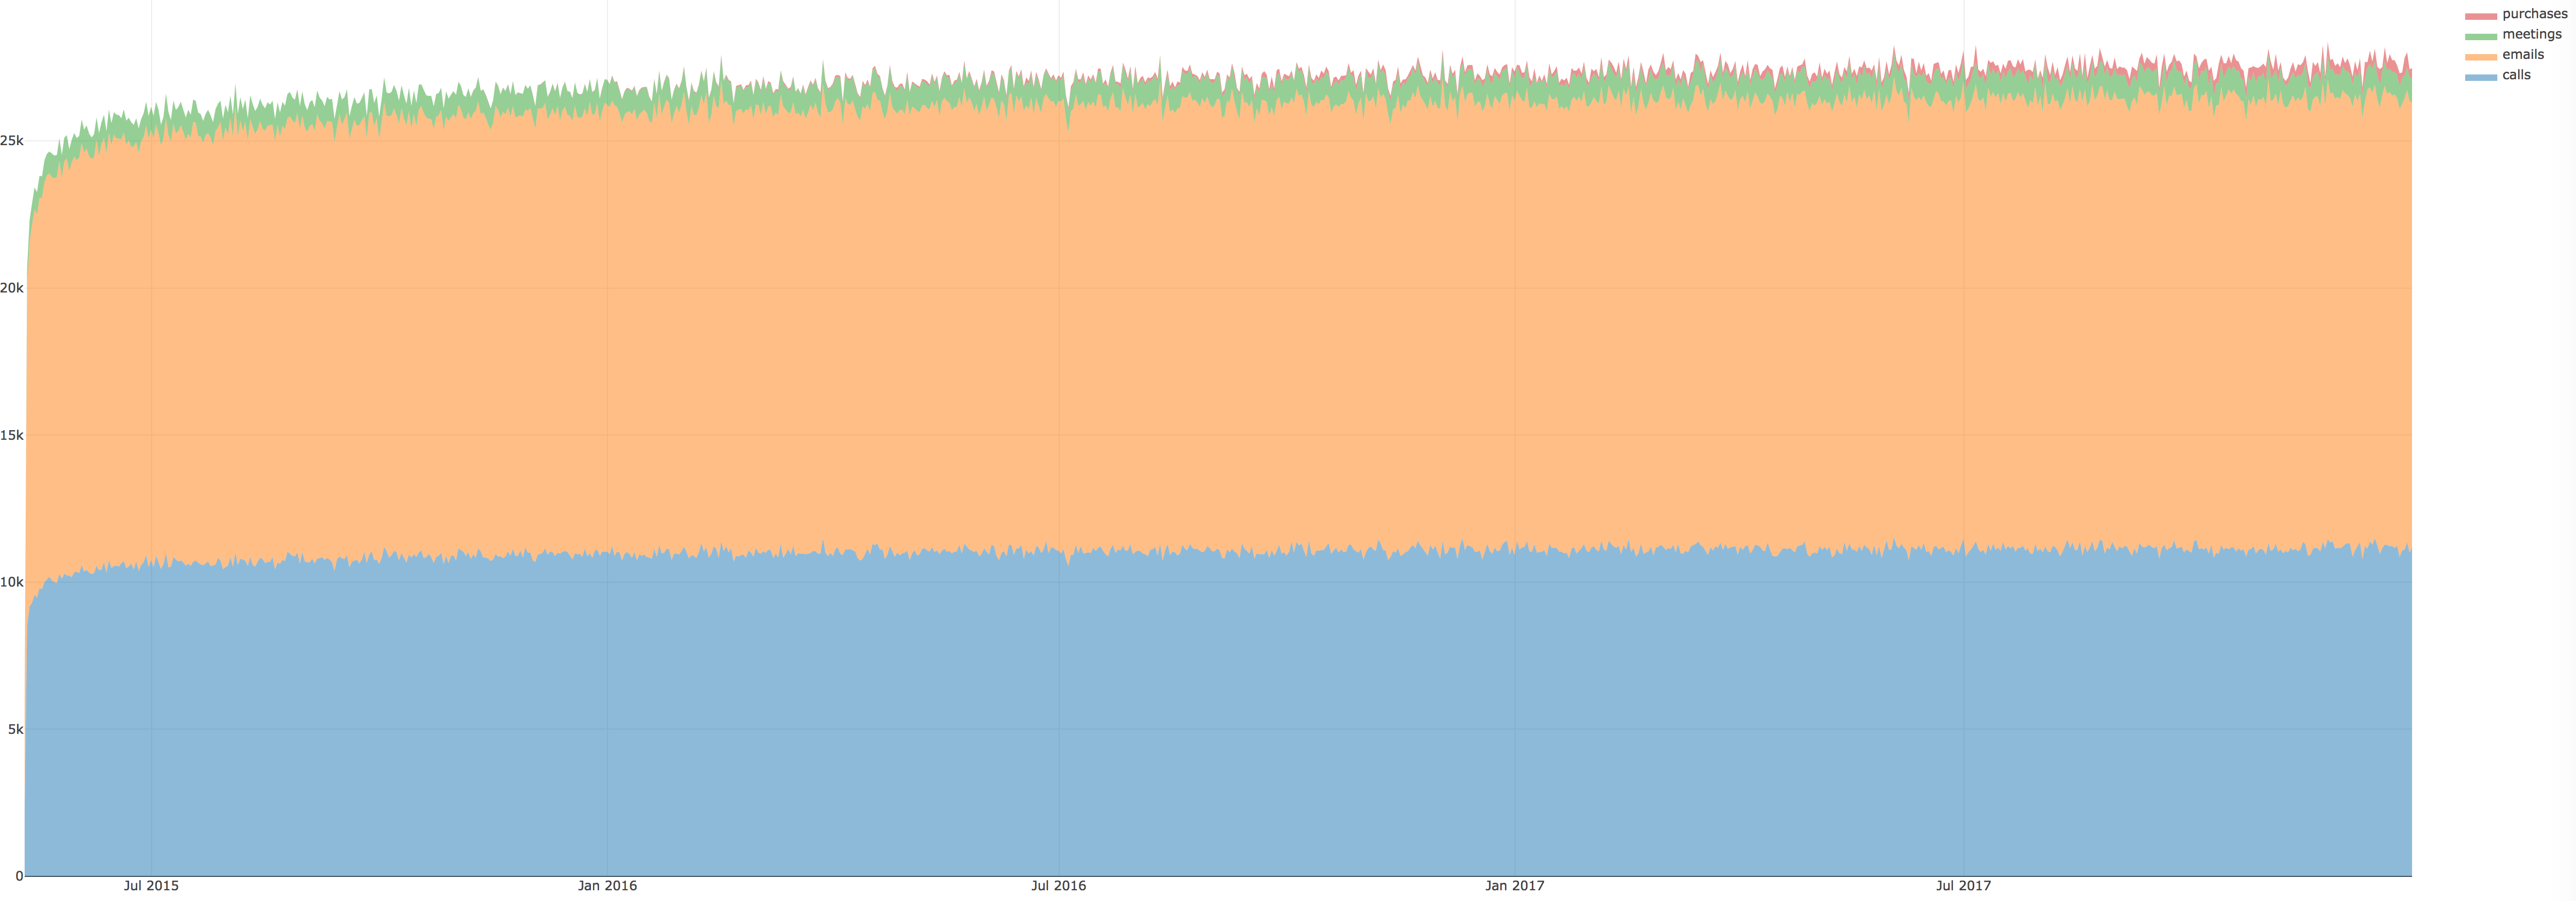
Figure 1: Kasios International's communications and purchase habits from 2015 to 2017.
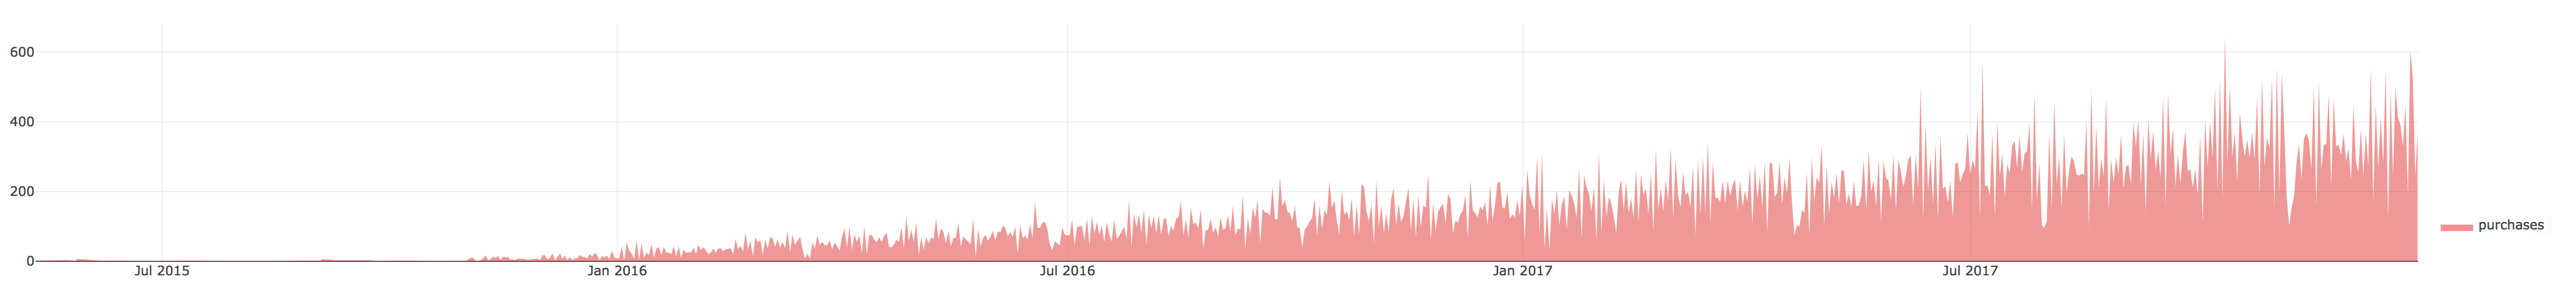
Figure 2: Kasios International's purchases from 2015 to 2017.
2.
Combine the four data sources for group that the insider has identified as being suspicious and locate the group in the larger dataset. Determine if anyone else appears to be closely associated with this group. Highlight which employees are making suspicious purchases, according to the insider's data.
Our visualization has 2 main components: The network view on the left and the timeline view on the right. Nodes are Kasios's employee, darker red nodes are suspicious people (as identified by the insider). Links (or arcs) are color-coded by activitiy category. We use arrows and clock-wise curvatures to indicate activity direction.
- The network view is implemented using Cola.js. We adopted the Flow Layout to force employees at the destinations of these activities (people who are receiving a call, receiving an email, selling something to a buyer, or being invited to a meeting) occupy lower positions in the network.
- The timeline view shows the same input data, focusing on when an activitiy occurs. Each horizontal dashed line represents an employee's lifetime. The timeline view allows to capture dynamics of the network.
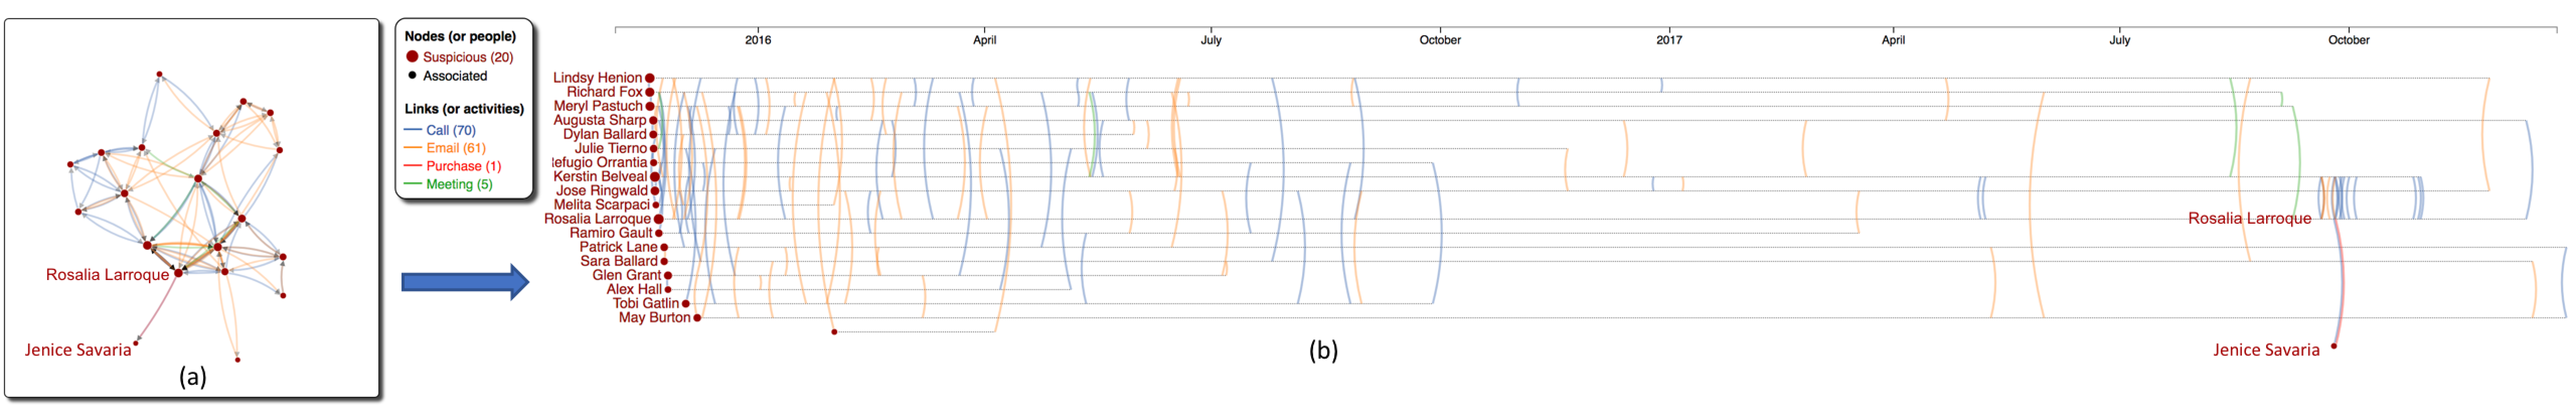
Figure 3: Ativities of 20 Kasios employees (red nodes) that the insider has identified as being suspicious: (a) Network view - Node sizes are computed based on their activities (b) Timeline view - Each dashed horizontal line presents a timeline of the employee whose name is printed at the beginning of his/her timeline.
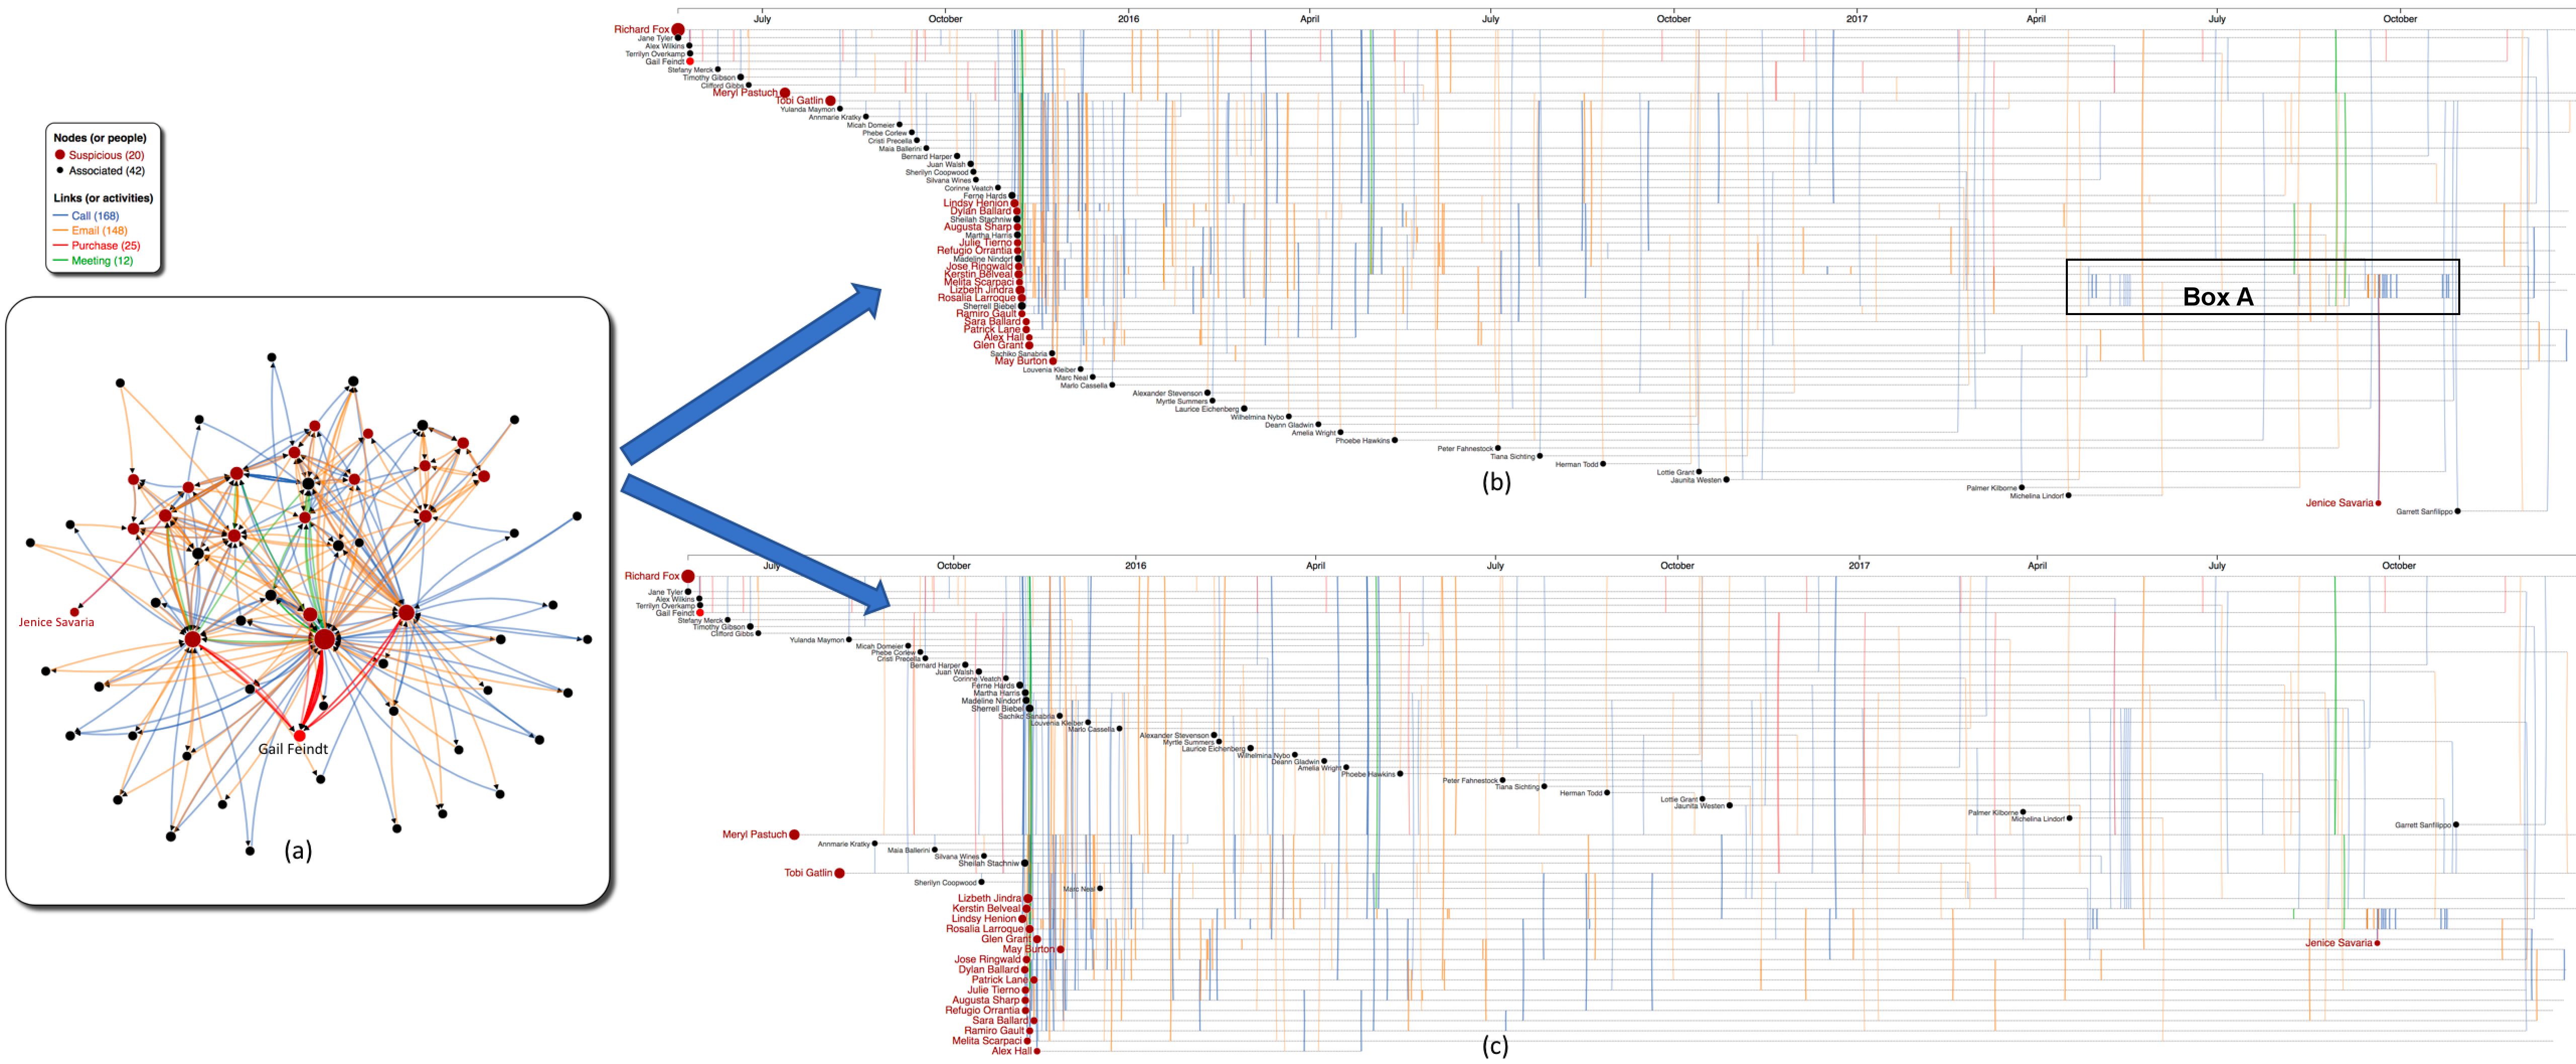
Figure 4: Ativities of 20 suspicious employees (red nodes) and 42 associated employees (black nodes): (a) Network view (b) Timeline view - nodes are vertically ordered by their first activity (c) Timeline view - nodes are ordered by where they are most associated with.
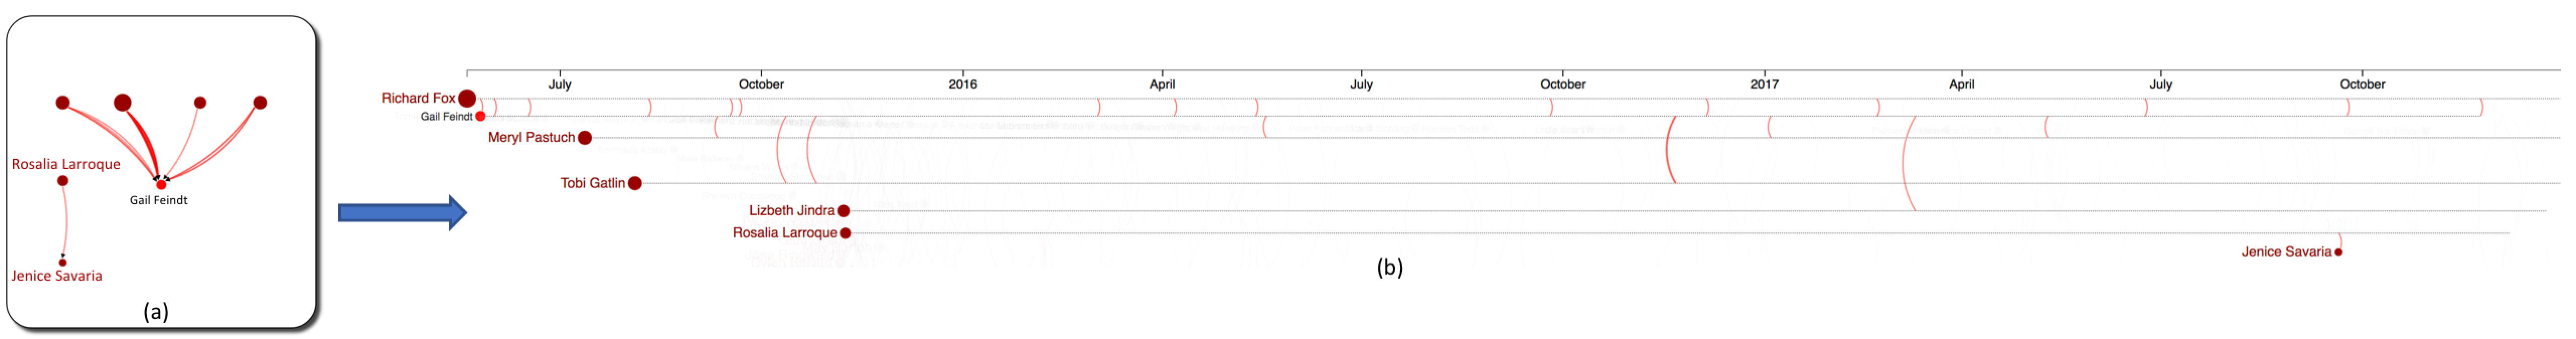
Figure 5: Purchase within the group of 20 suspicious employees: (a) Network view constrained vertically by the purchase flow (top is the purchaser) (b) Timeline view of 25 purchases.
3.
Using the combined group of suspected bad actors you created in question 2, show the interactions within the group over time. Limit your responses to 10 images and 1000 words
(a) Characterize the group's organizational structure and show a full picture of communications within the group.
(b) Does the group composition change during the course of their activities?
(c) How do the group's interactions change over time?
Figure 6 show a full picture of communications within the group of 62 bad actors. As depicted, there are lot of activities within the group of 42 associated employees. Suspicious activities are displayed in thicker links.
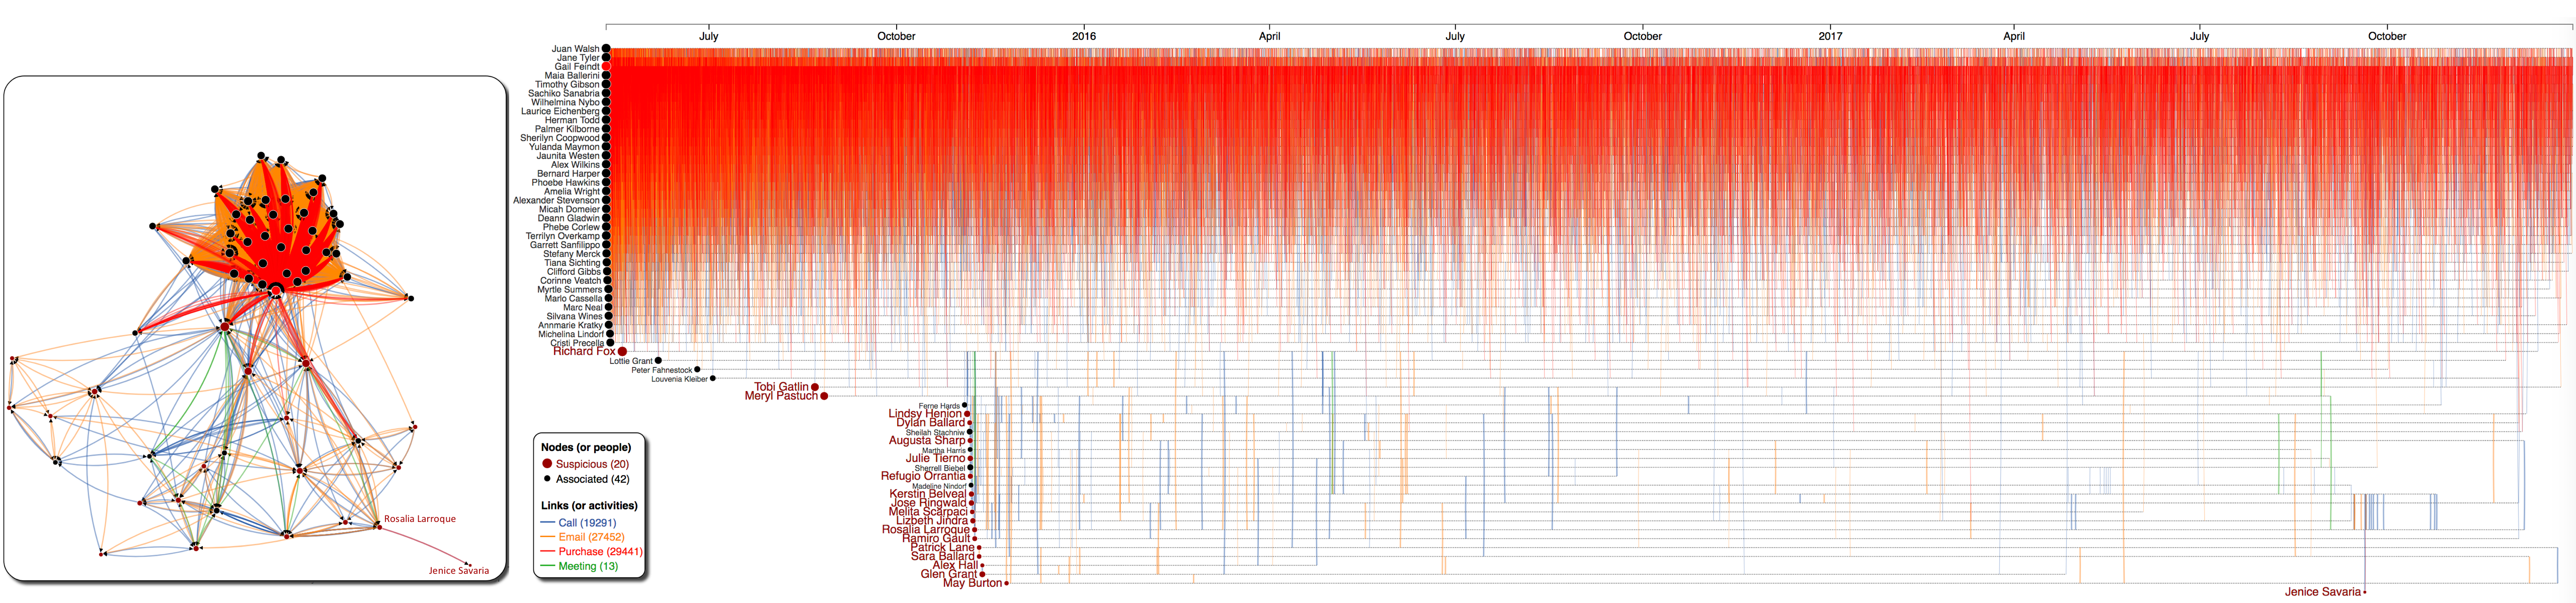
Figure 6: All activities (calls, emails, meetings, and purchases) within the group of 20 suspicious and 42 associated employees.
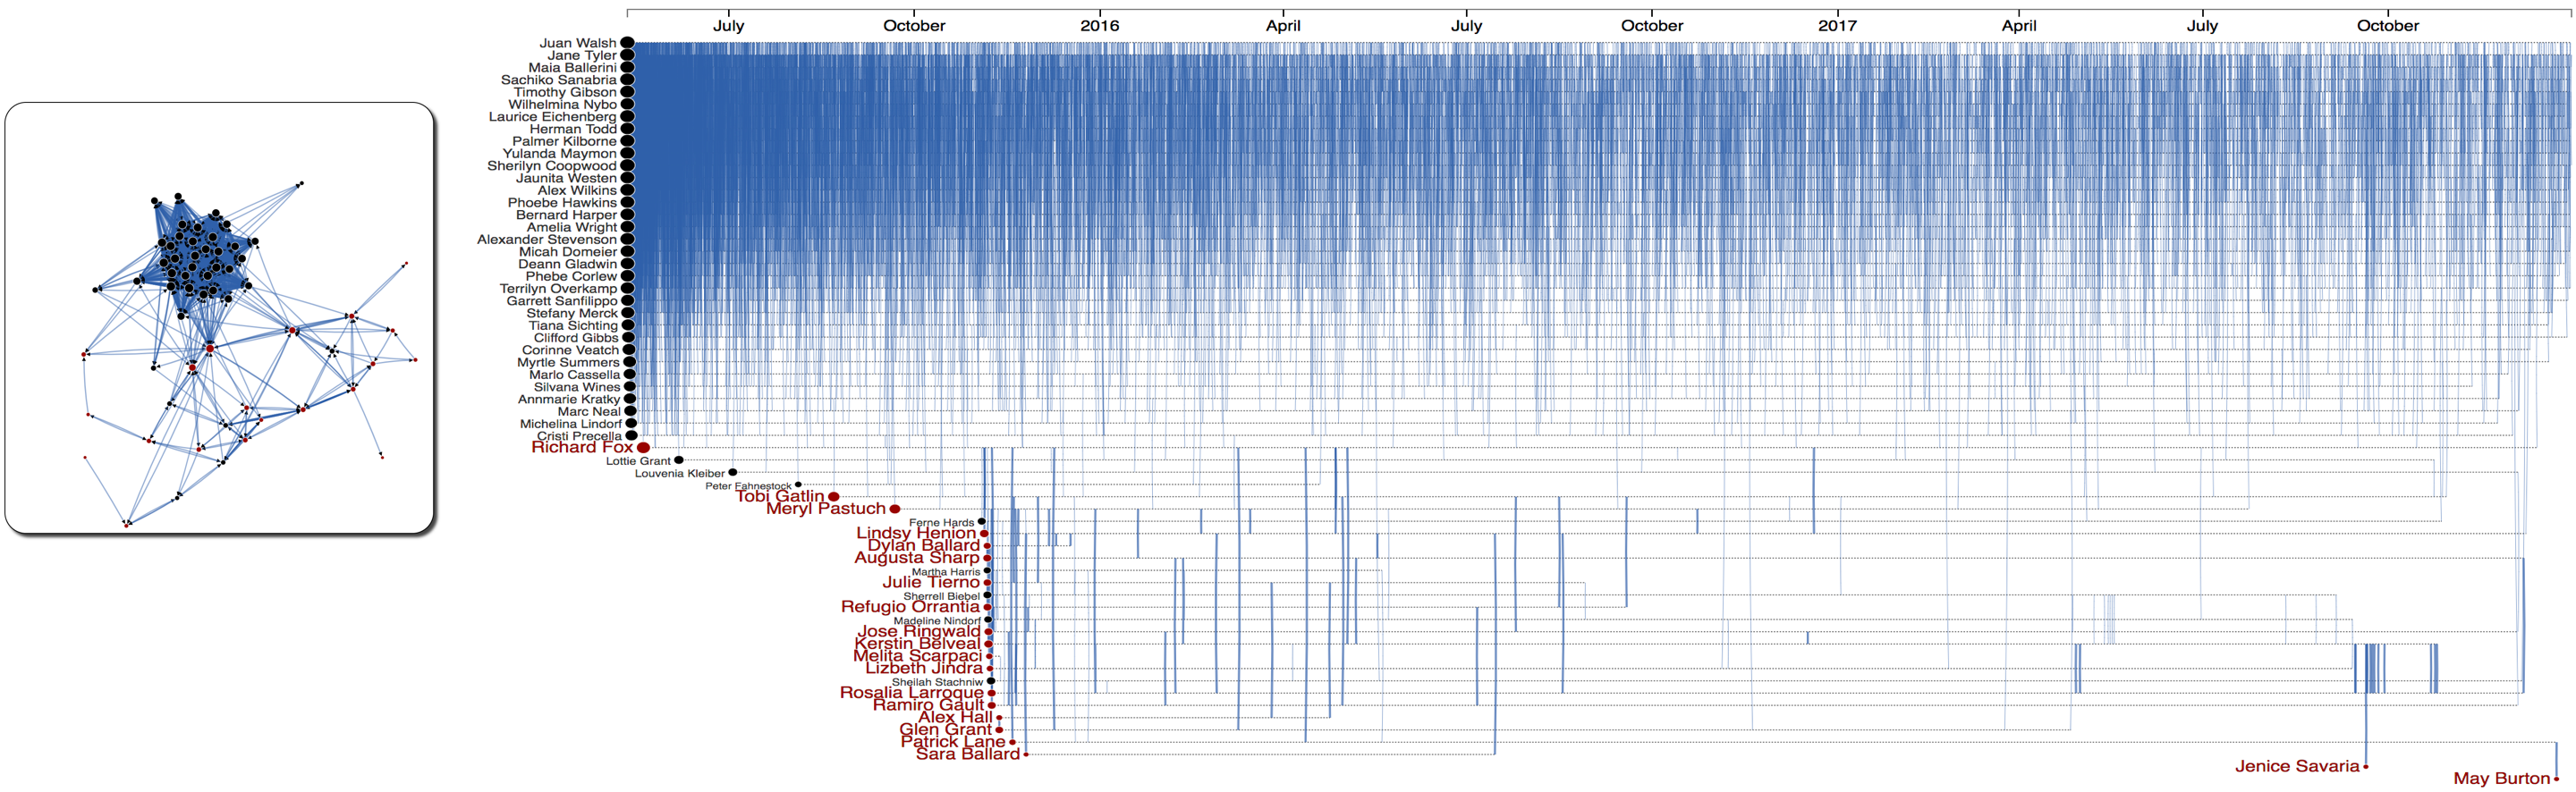
Figure 7: Phone calls within the group of 20 suspicious and 42 associated employees. Calls are decreased by year.
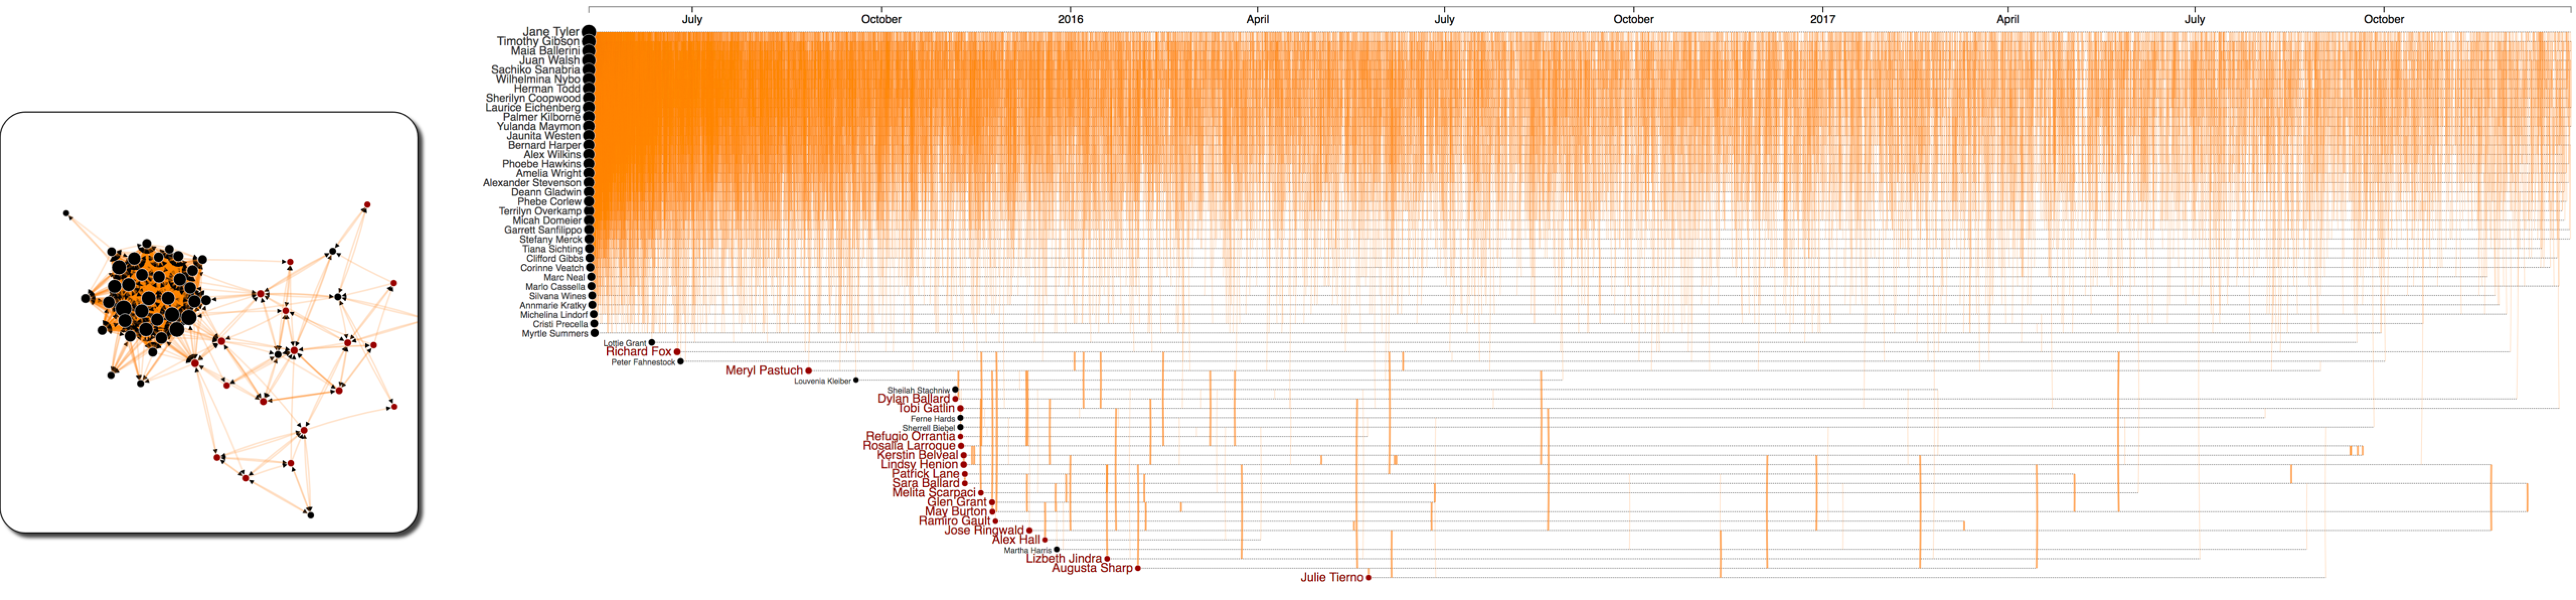
Figure 8: Email communications within the group of 20 suspicious and 42 associated employees. Emails are decreased by year.
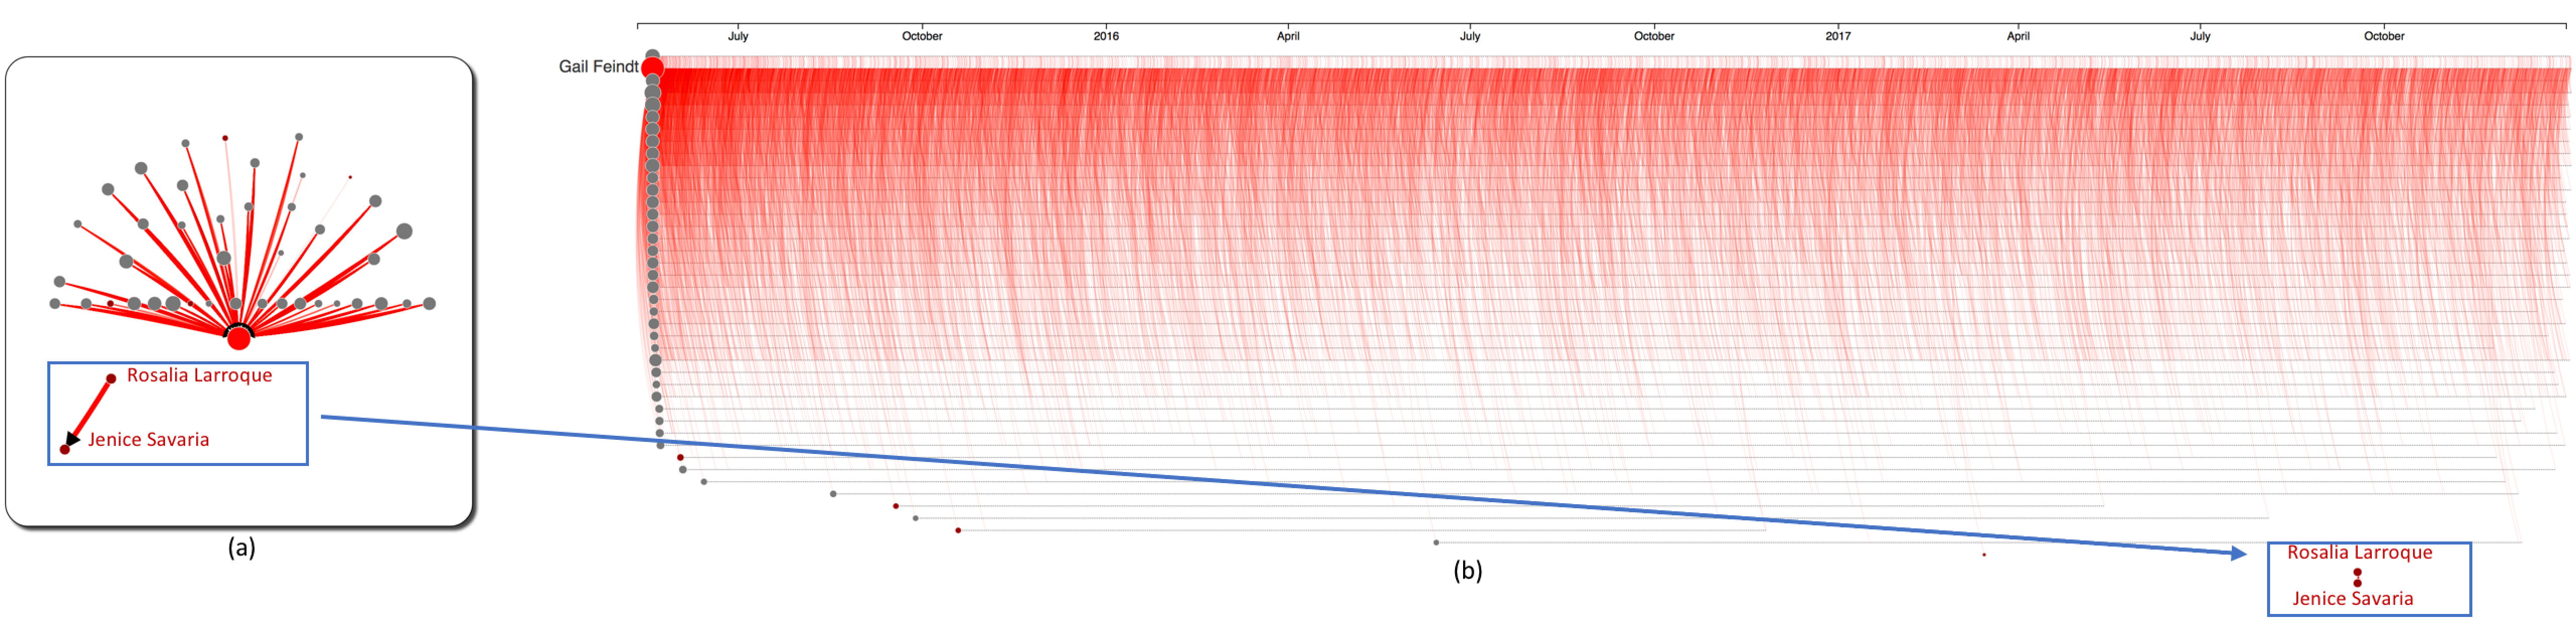
Figure 9: Purchases within the group of 62 bad actors. While Gail Feindt (the red node) appears to be the main distributor (of the purchases), the transaction between Rosalia Larroque and Jenice Savaria stand out as a suspicious purchase.
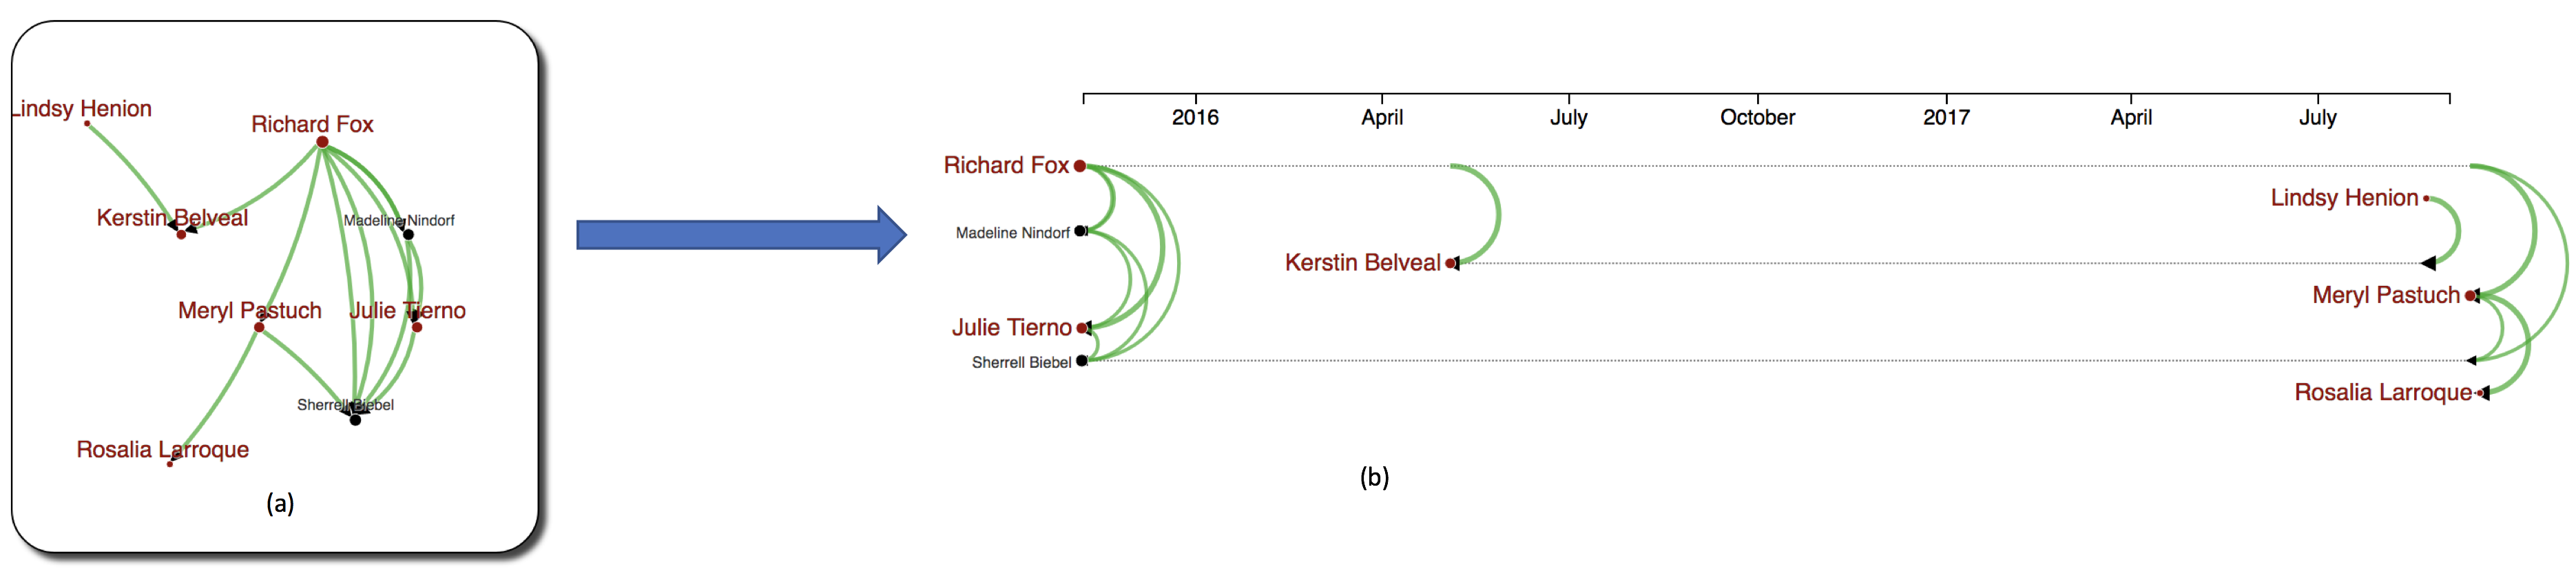
Figure 10: The group's organizational structure can be inferred partially through the meetings. This organizational structure changes over time. For example, Richard Fox does not invite Madeline Nindorf and Julie Tierno any longer after 2016. Instead, he met Meryl Pastuch who involved indirectly in the suspicious purchase.
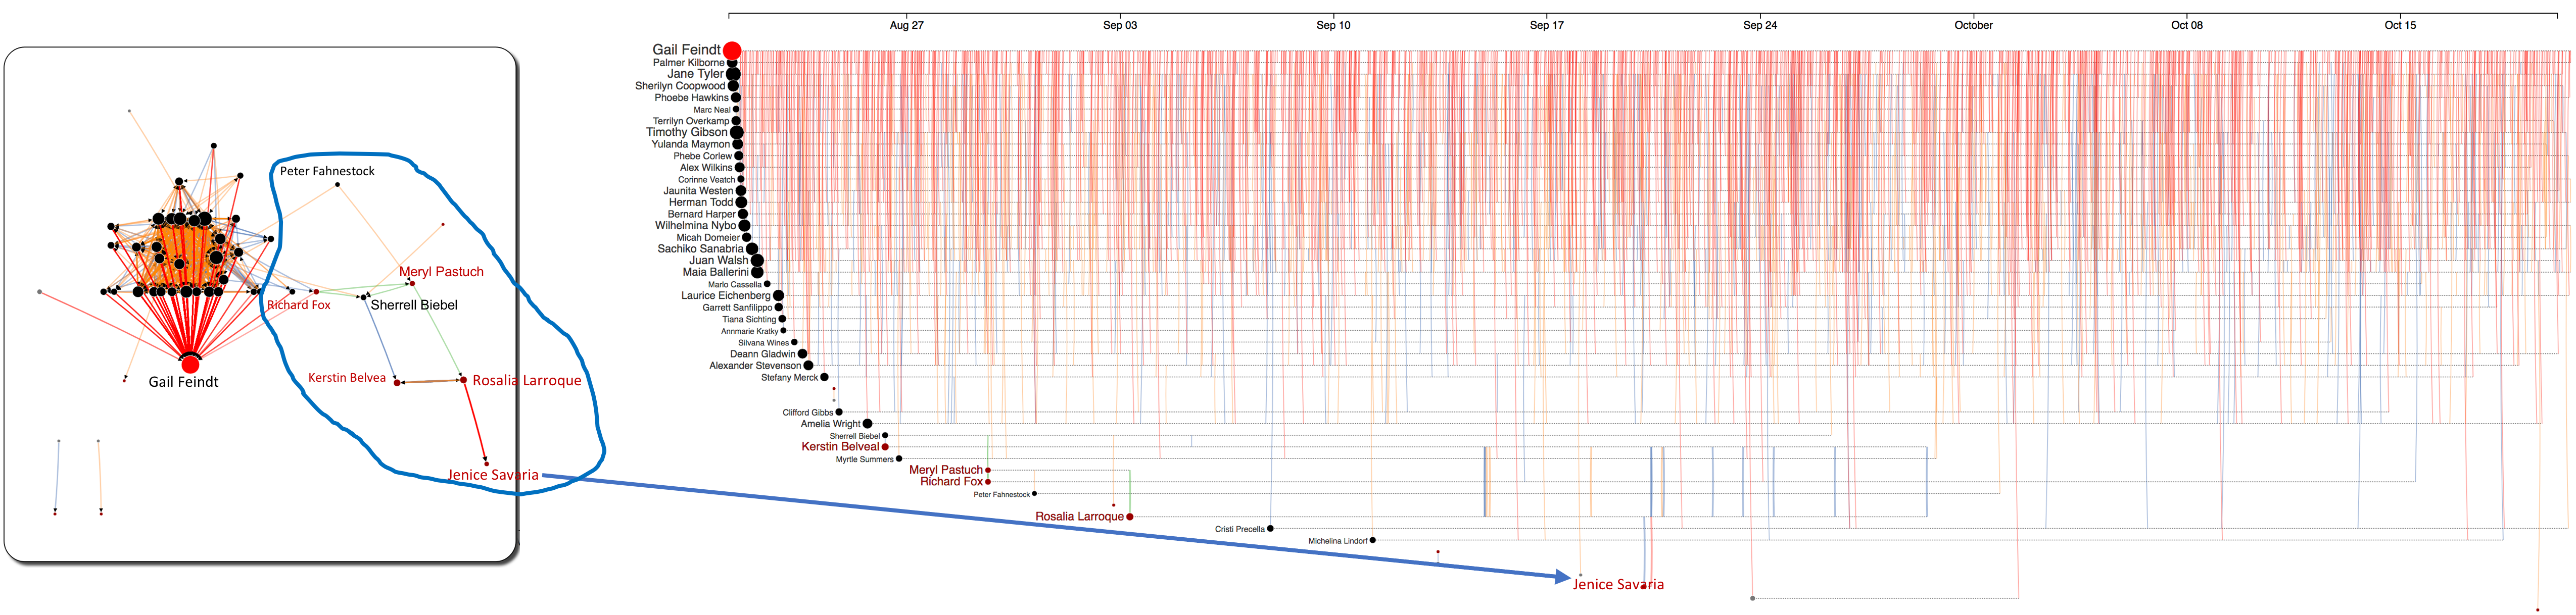
Figure 11: Purchases within the group of 62 bad actors. The highlighted group had several meetings, calls, and emails leading to the final purchase from Rosalia Larroque to Jenice Savaria.
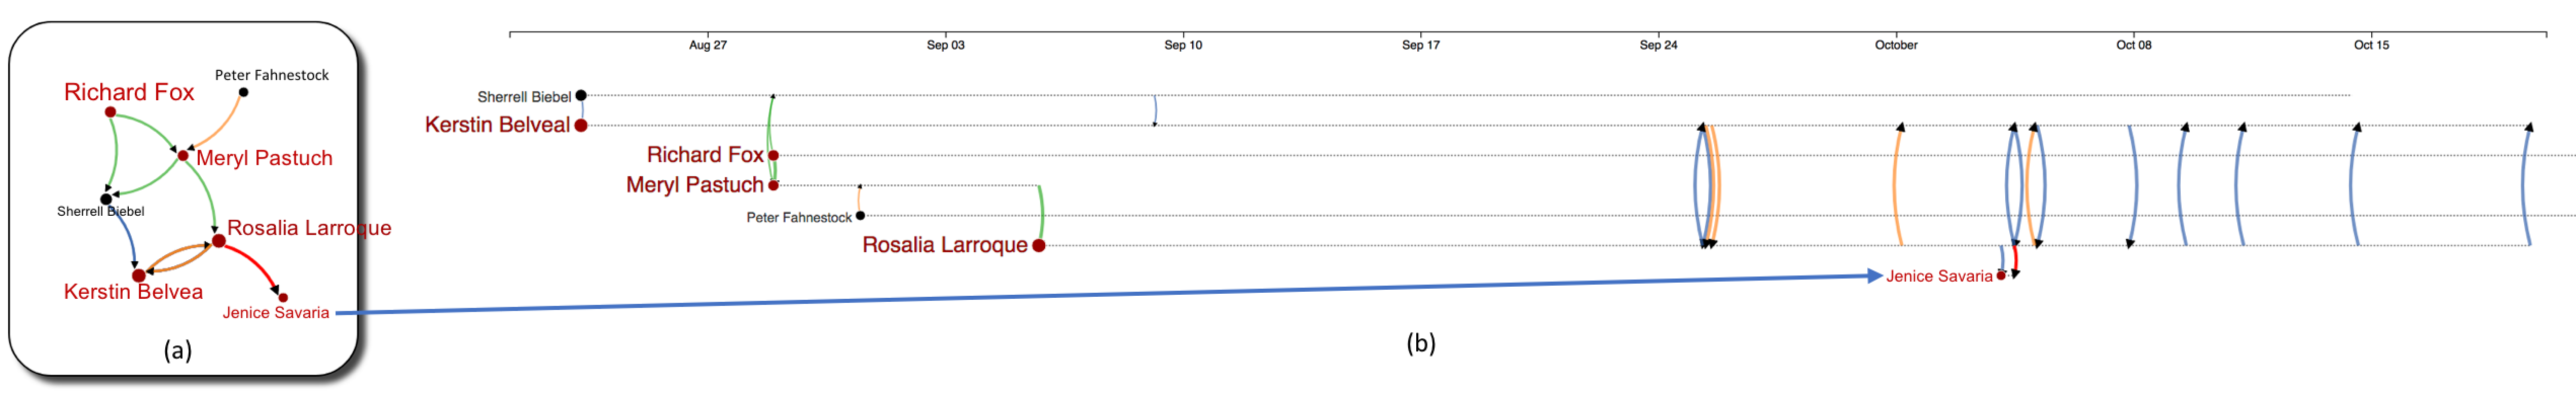
Figure 12: Inspecting the suspicious purchase of Rosalia Larroque - Jenice Savaria: (a) Network view of related people within the 4-level seperation from the Jenice Savaria (b) Timeline view if the same network - time is expanded from August 20 to October 20 of 2017. From this view, we can see that Rosalia Larroque had called Jenice Savaria serveral hours before the suspicious purchase happened. Rosalia Larroque was on the phone with Kerstin Belveal while she performed the purchase and the communication (emails and calls) continued several days after the purchase (as it happened several days before). Notably, the transaction was perform in the early morning (around 4am of Wednesday 20, 2017) as we mouse over the arc/link.
4.
The insider has provided a list of purchases that might indicate illicit activity elsewhere in the company. Using the structure of the first group noted by the insider as a model can you find any other instances of suspicious activities in the company? Are there other groups that have structure and activity similar to this one? Who are they? Each of the suspicious purchases could be a starting point for your search. Provide examples of up to two other groups you find that appear suspicious and compare their structure with the structure of the first group. The structures should be presented as temporal not just structural (i.e., the sequence of events-A is followed by B one or two days later- will be important). Limit your responses to 10 images and 1200 words.
Starting from the list of purchases that might indicate illicit activity elsewhere in the company, we expand our search to other related activities of 1 day before and 1 day after (link crawling). The following figure shows an overview of the obtained data. Rings in the network on the left represent associated employees extracted at different levels (from the suspicious events) in the crawling process. Vertical collumns in the timeline present activities around the suspicious purchases provided by the insider. We will inspect each collumn at a time in Figure 14, 15, and 16.
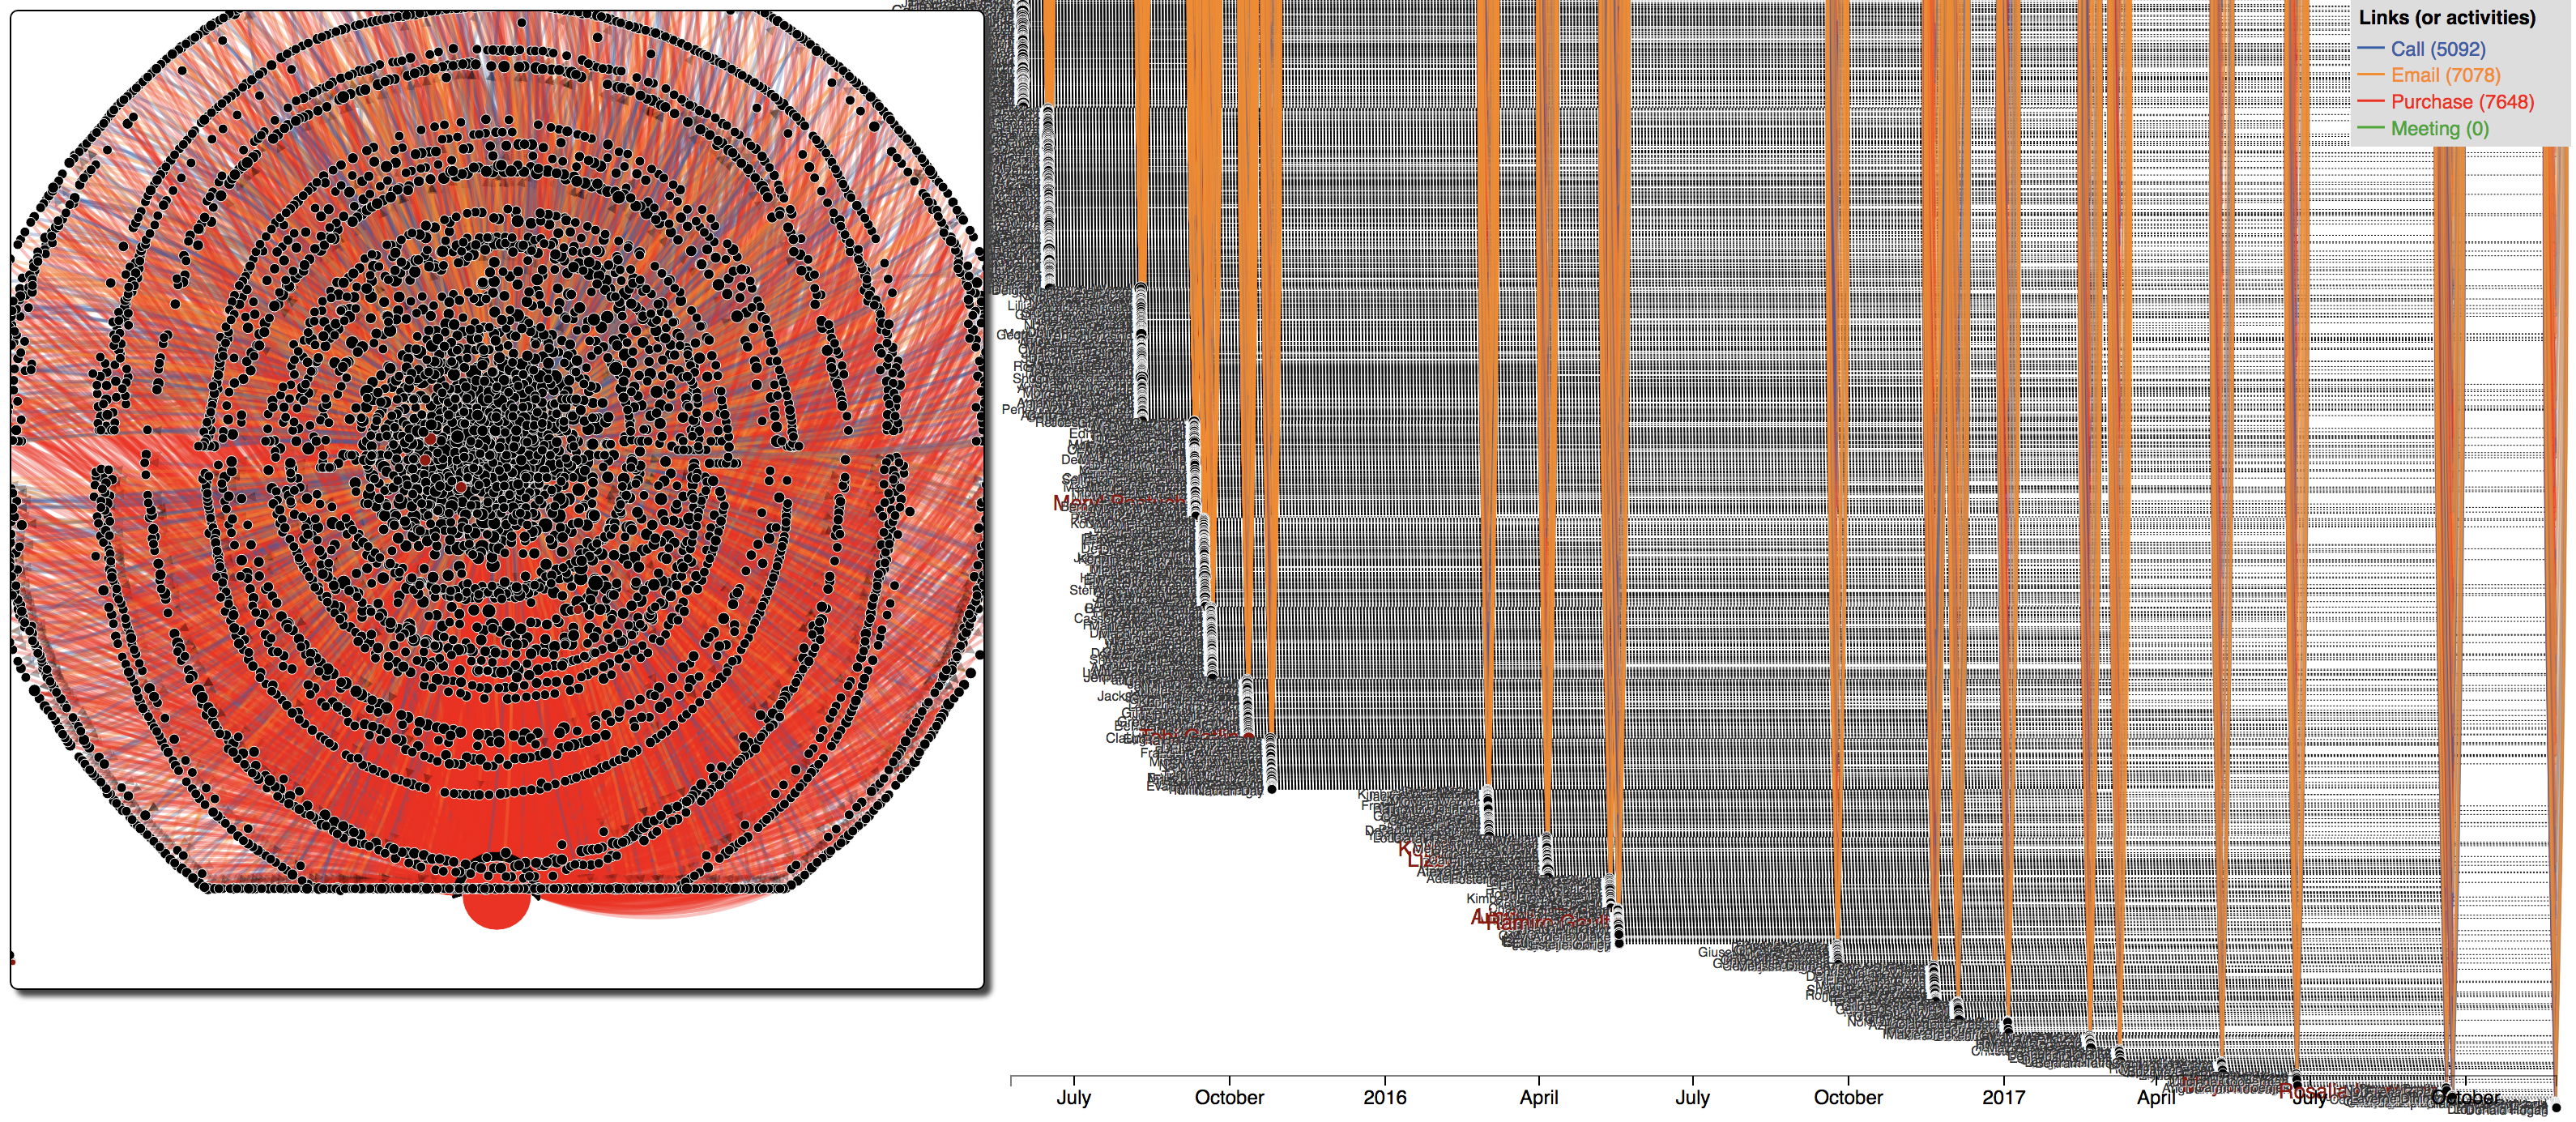
Figure 13: Kasios's employees and their activities in 1 day before and 1 day after the suspicious purchases provided by the insider.
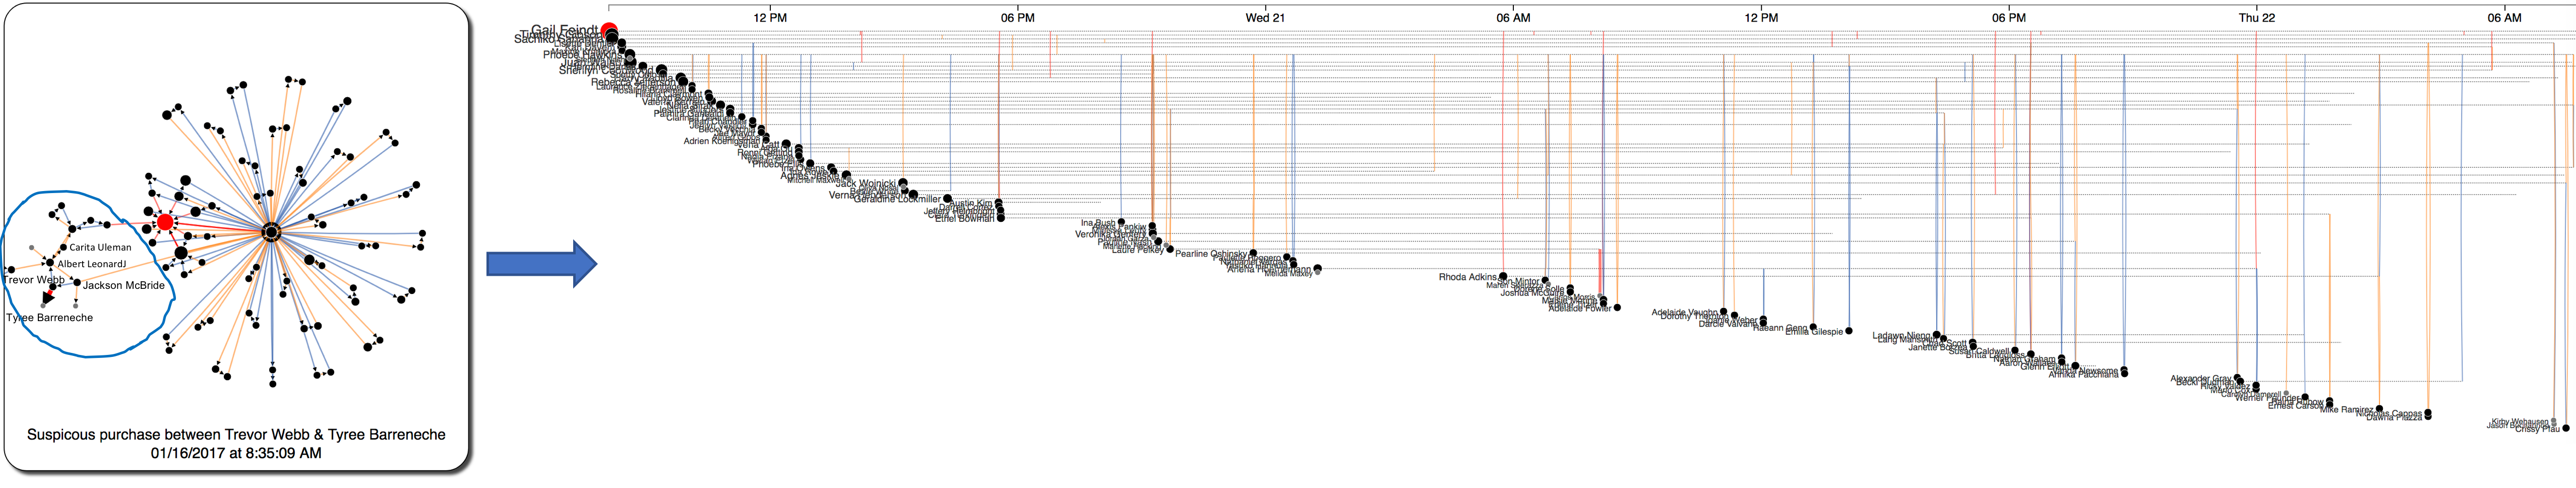
Figure 14: Starting from the purchase between Trevor Weeb and Tyree Barreneche, we retrieved other related employees in 4 levels of seperation (we can crawl further levels which ends up thousands of employees to show in the network). We can see that this group is seperated from the main network which contains all purchase through Gail Feindt, the main distributor of Kasios International. These unusual communications leading to the final purchase is similar to the structure of the first group identified in Figure 11.
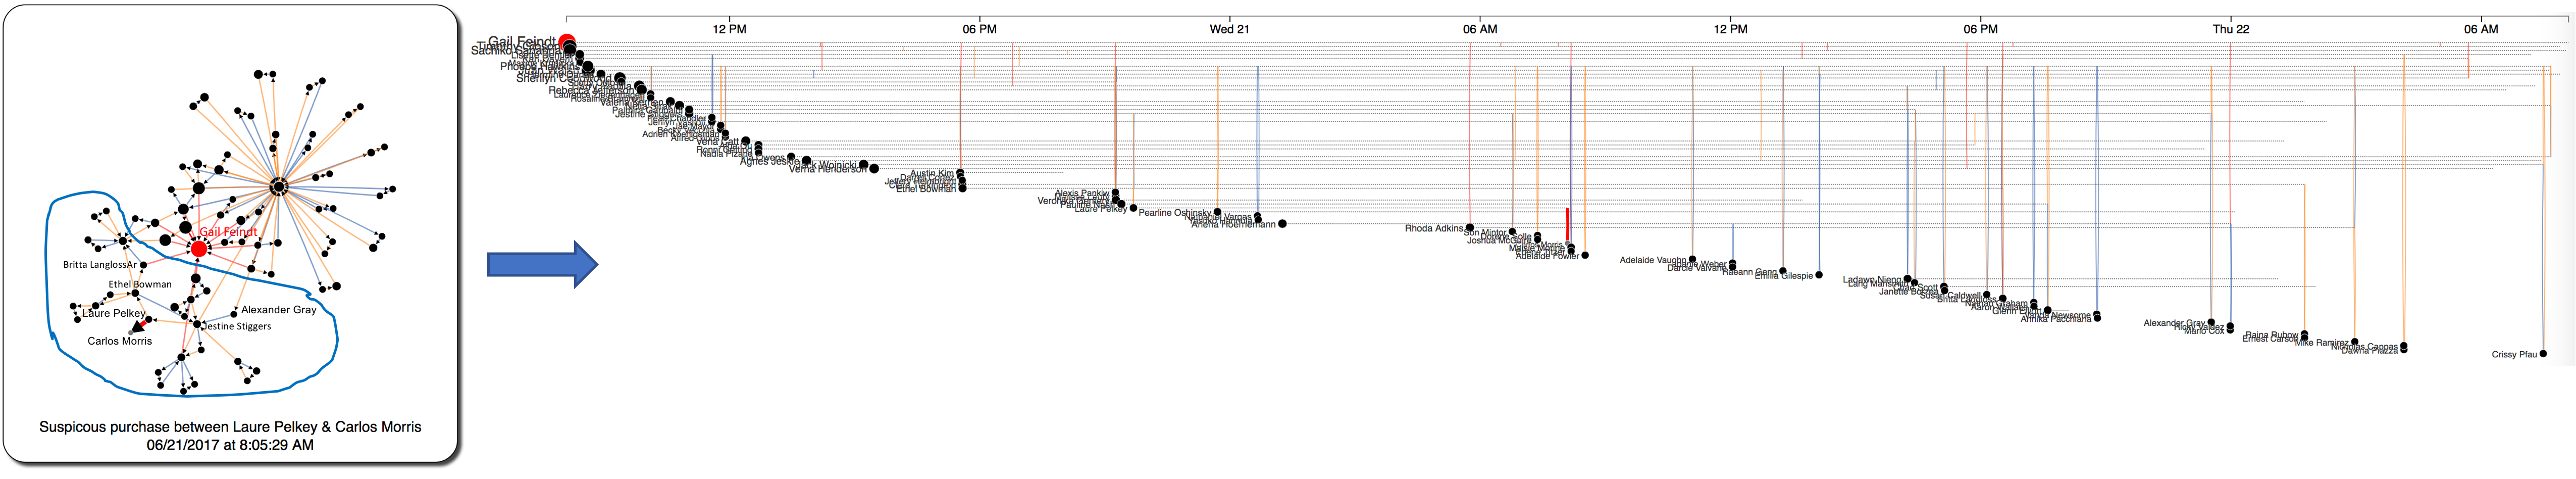
Figure 15: Another example of a group with similar structure. In this example, we start the crawling process from the purchase between Laure and Carlos Morris on June 21, 2017 at 8:05 AM. All related people and activities within 24 hours of the purchase transaction are labled in the network on the left. Again, the purchase was perform through a new name Carlos Morris (not the main Kasios's distributor). Moreover, we can easily notice in the timeline view: there are many cliques of 3 employees right before and after every purchase. We will inspect this temporal structure further in Figure 17.
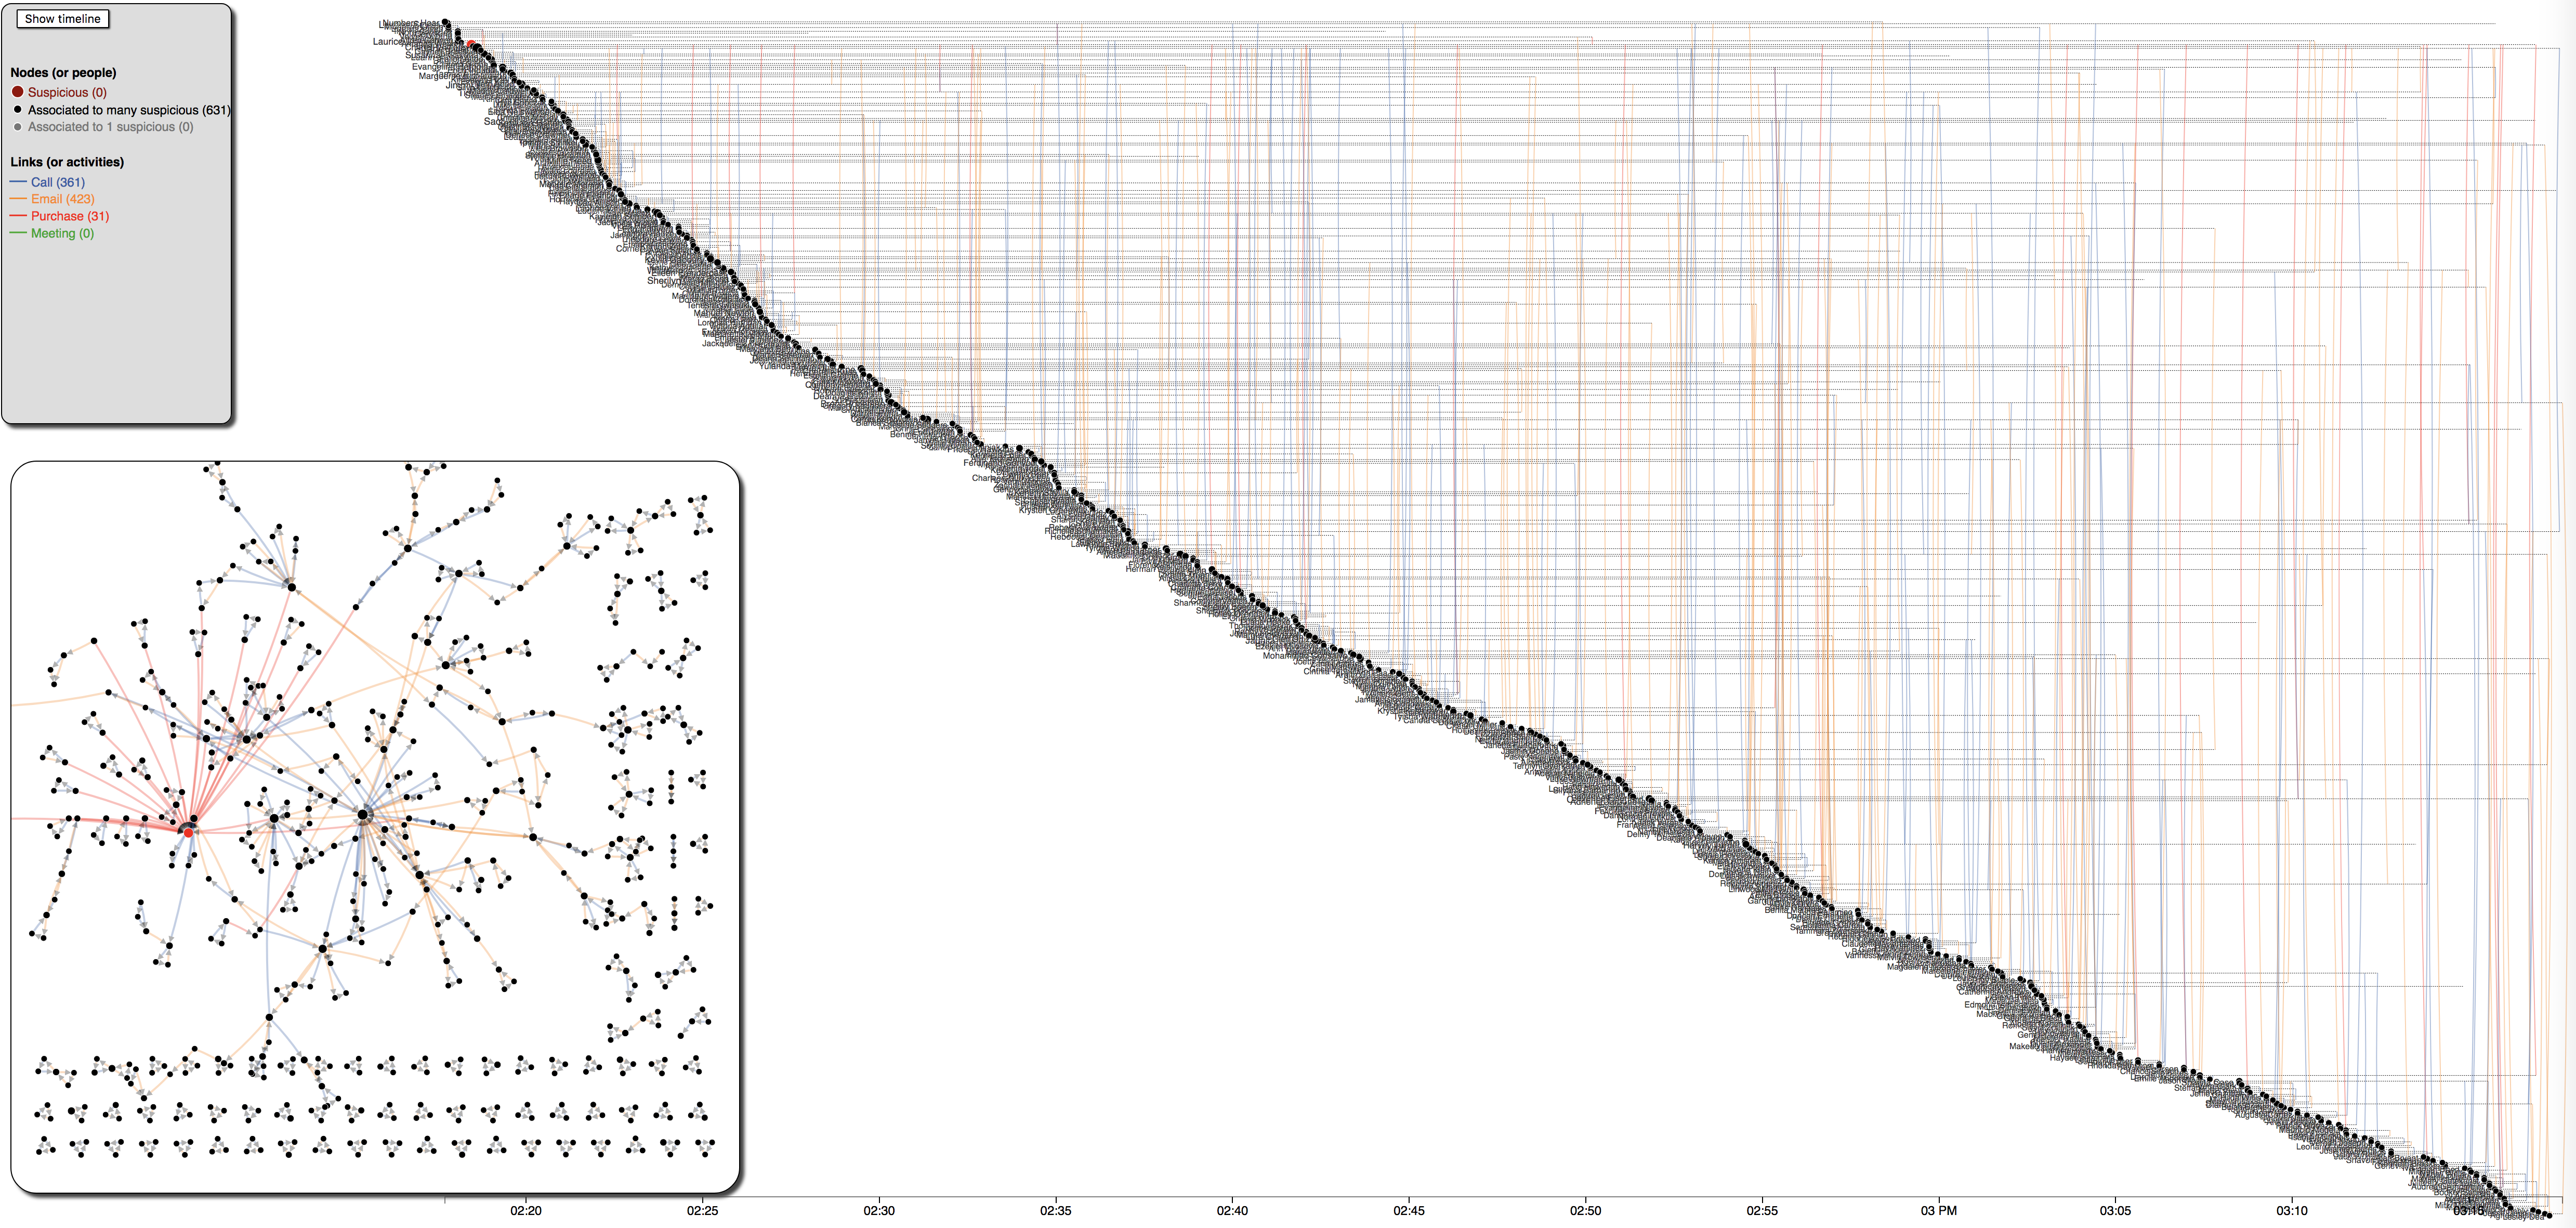
Figure 16: 1-hour communications within Kasios International dataset. The networks are characterized by cliques of 3.
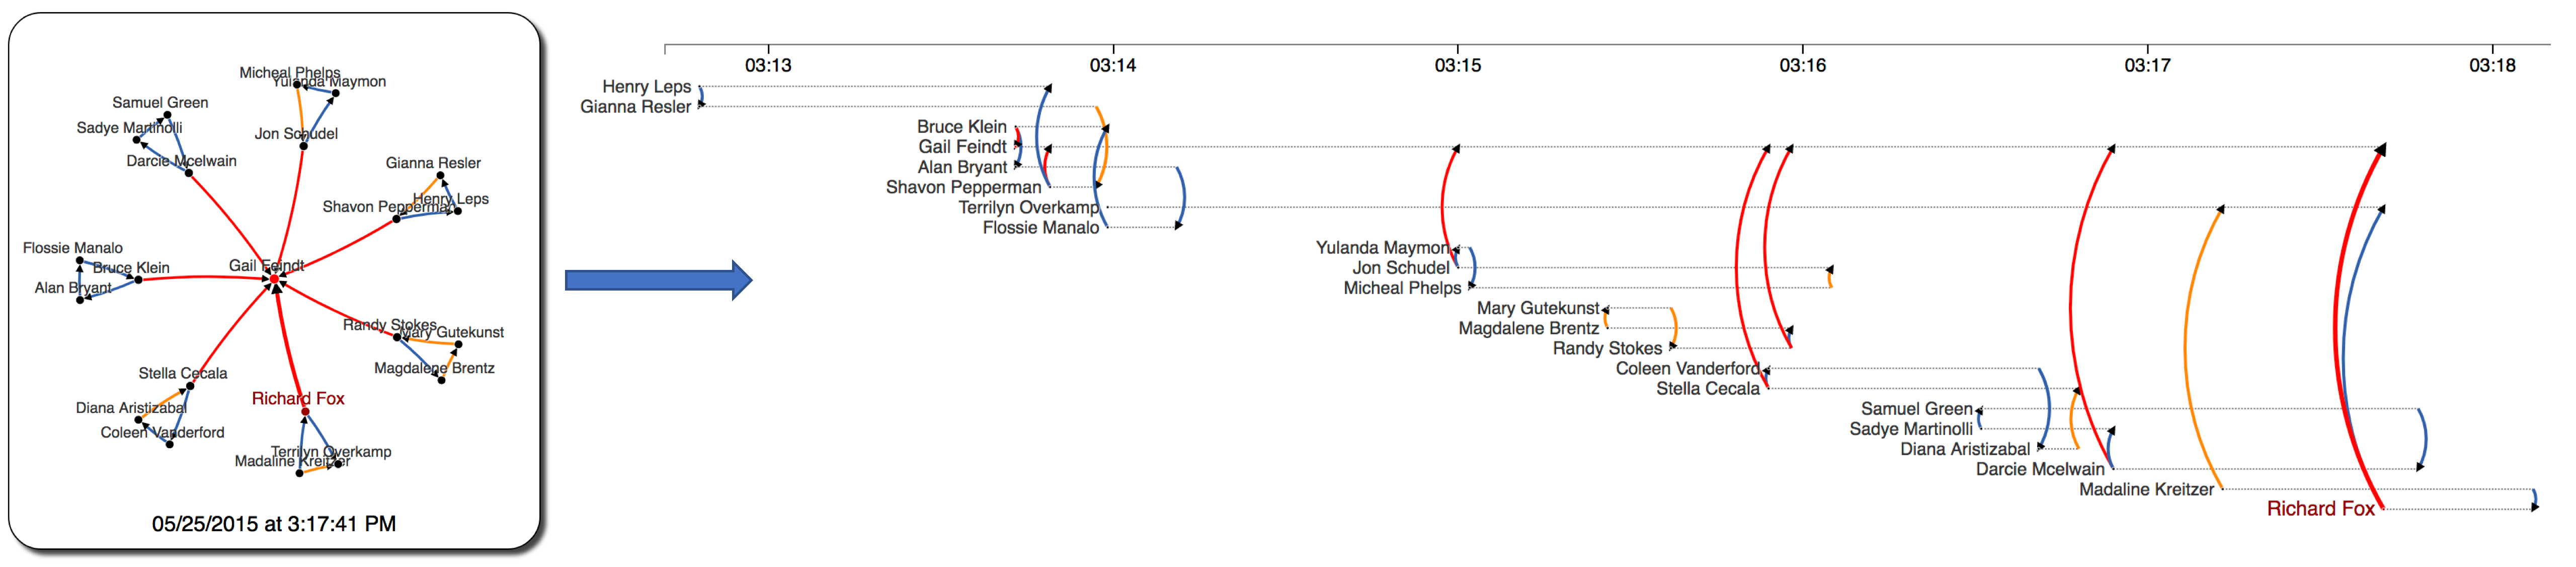
Figure 17: 5 minutes communications within Kasios International.