Entry Name: "TTU-Nguyen-MC3"
VAST Challenge 2019
Mini-Challenge 3

Team Members:

Huyen Nguyen, IDV Lab, Texas Tech University, huyen.nguyen@ttu.edu   PRIMARY
Tommy Dang, IDV Lab, Texas Tech University, tommy.dang@ttu.edu

Student Team: YES

Tools Used:

HTML, CSS, JavaScript
D3.js
GitHub:
https://idatavisualizationlab.github.io/VAST2019mc3/

Approximately how many hours were spent working on this submission in total?

320 hours.

May we post your submission in the Visual Analytics Benchmark Repository after VAST Challenge 2019 is complete? YES

Video

https://idatavisualizationlab.github.io/VAST2019mc3/video.html


System Overview

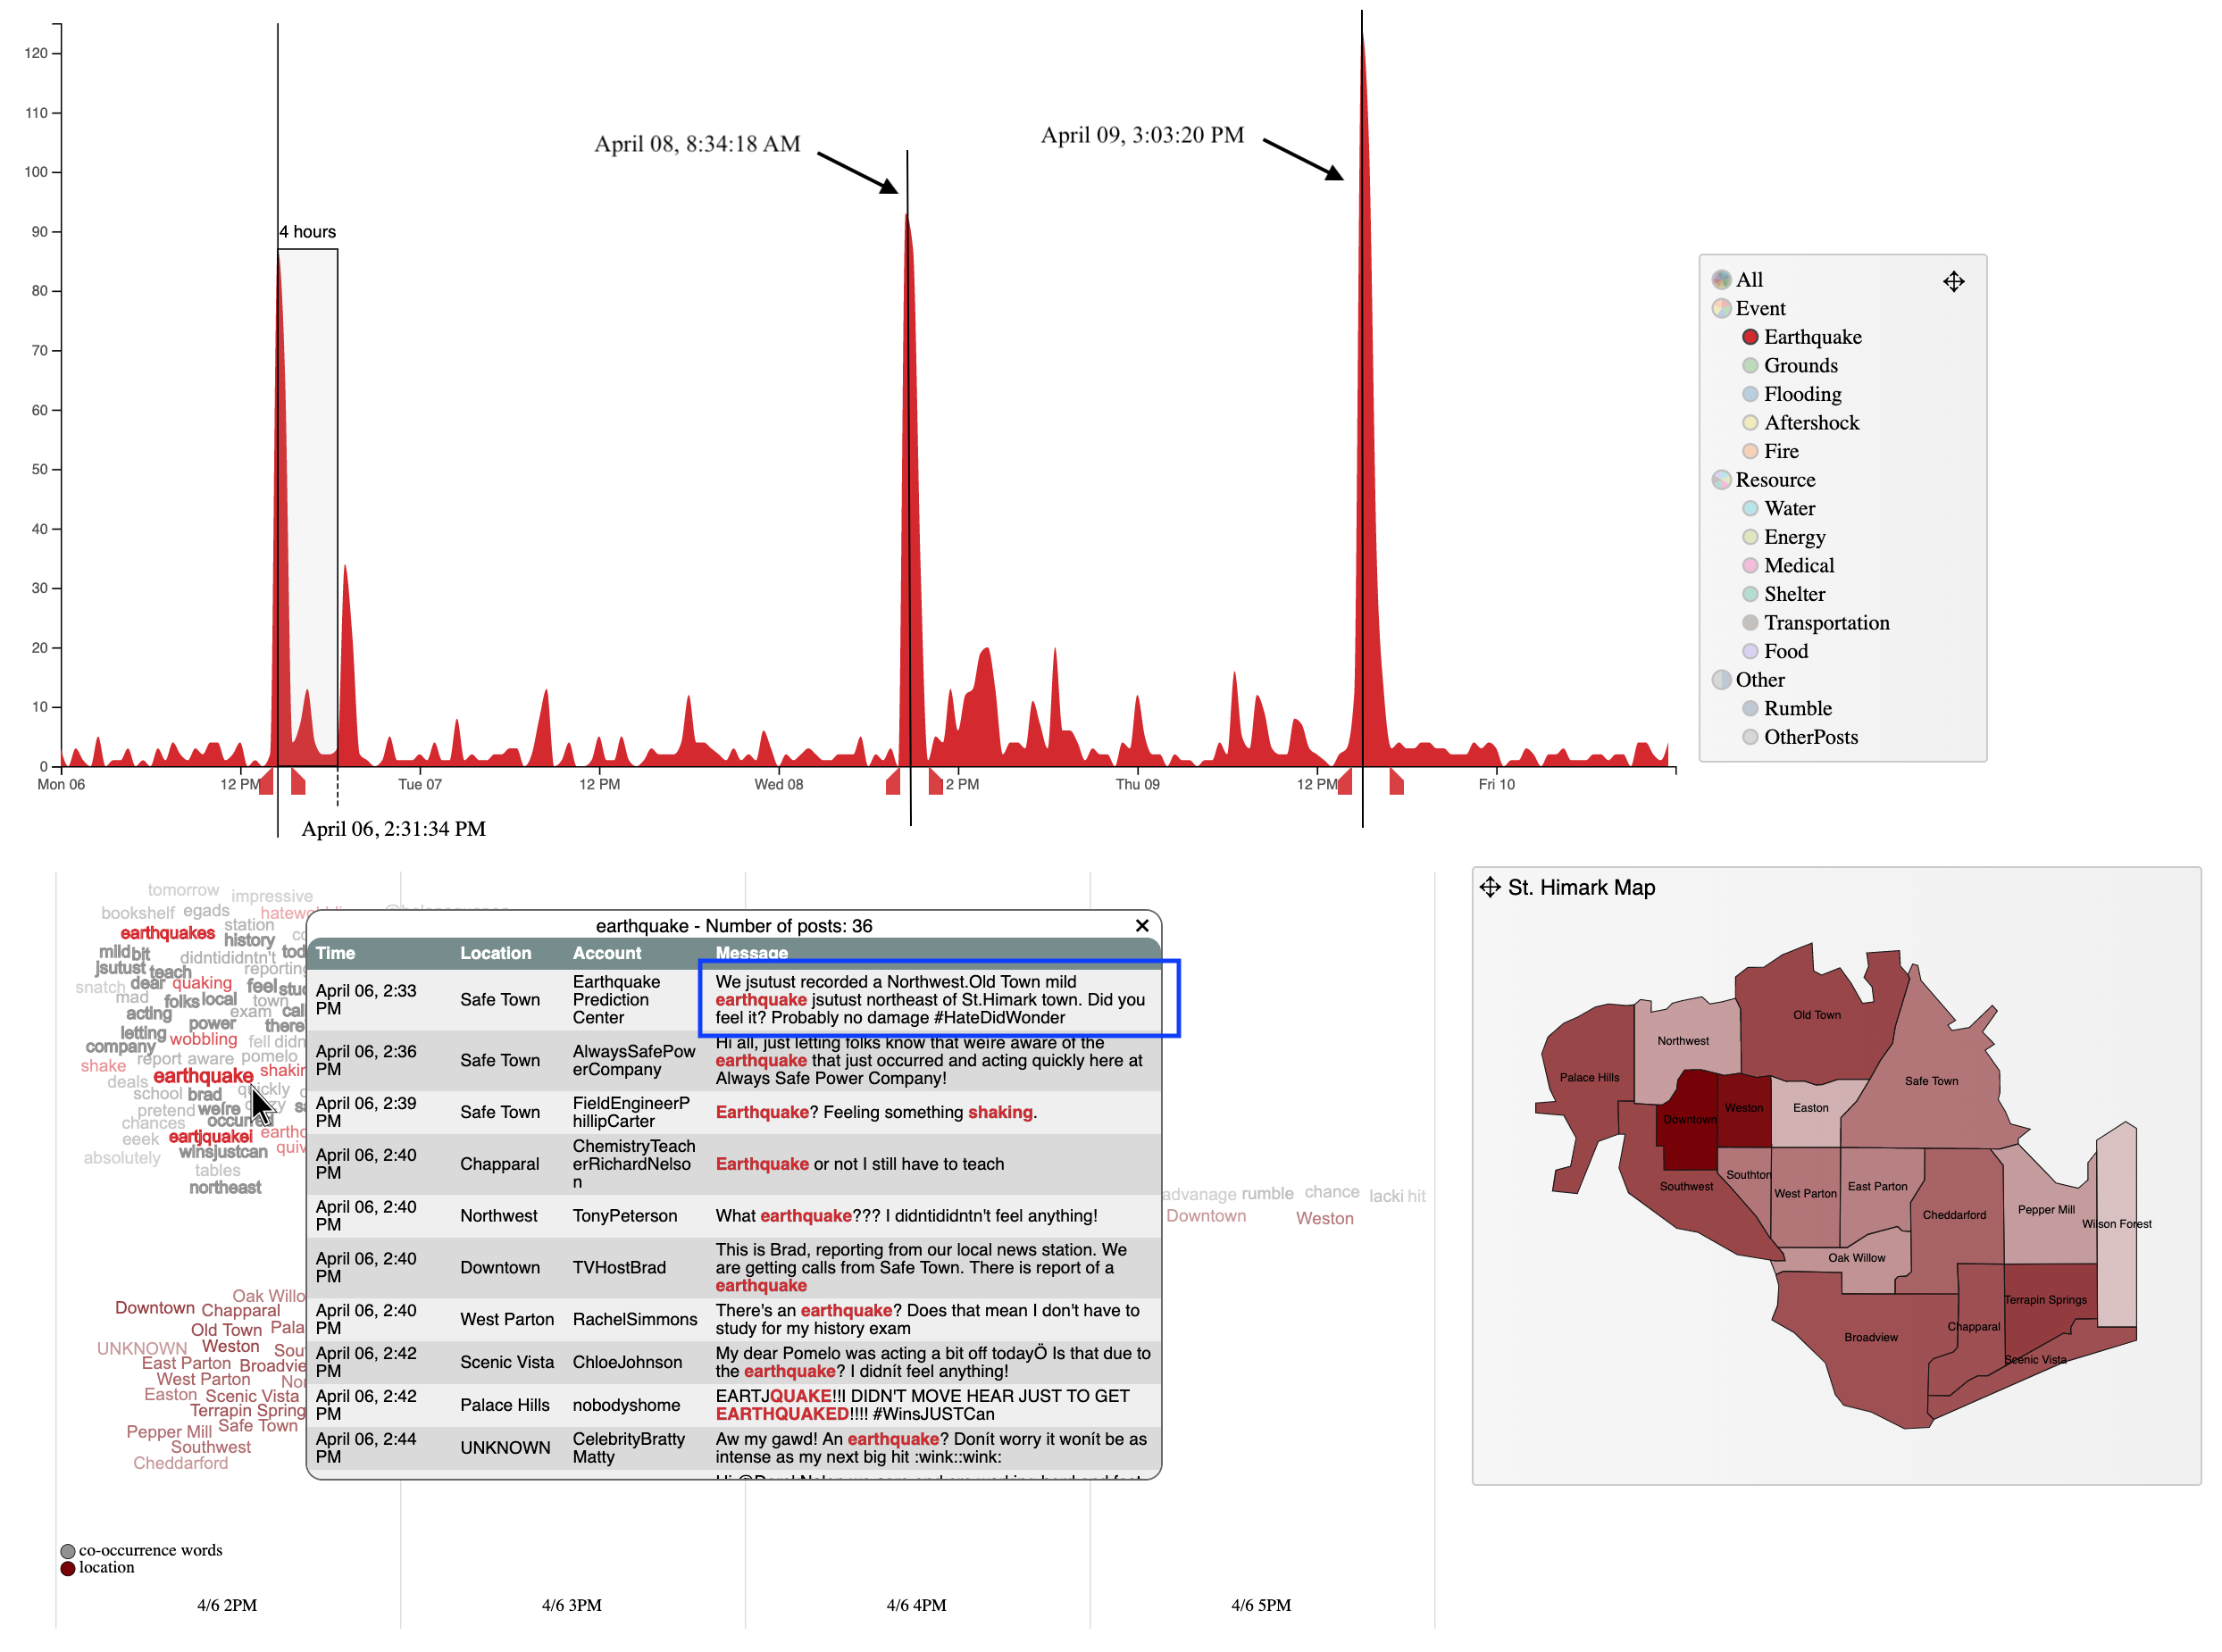
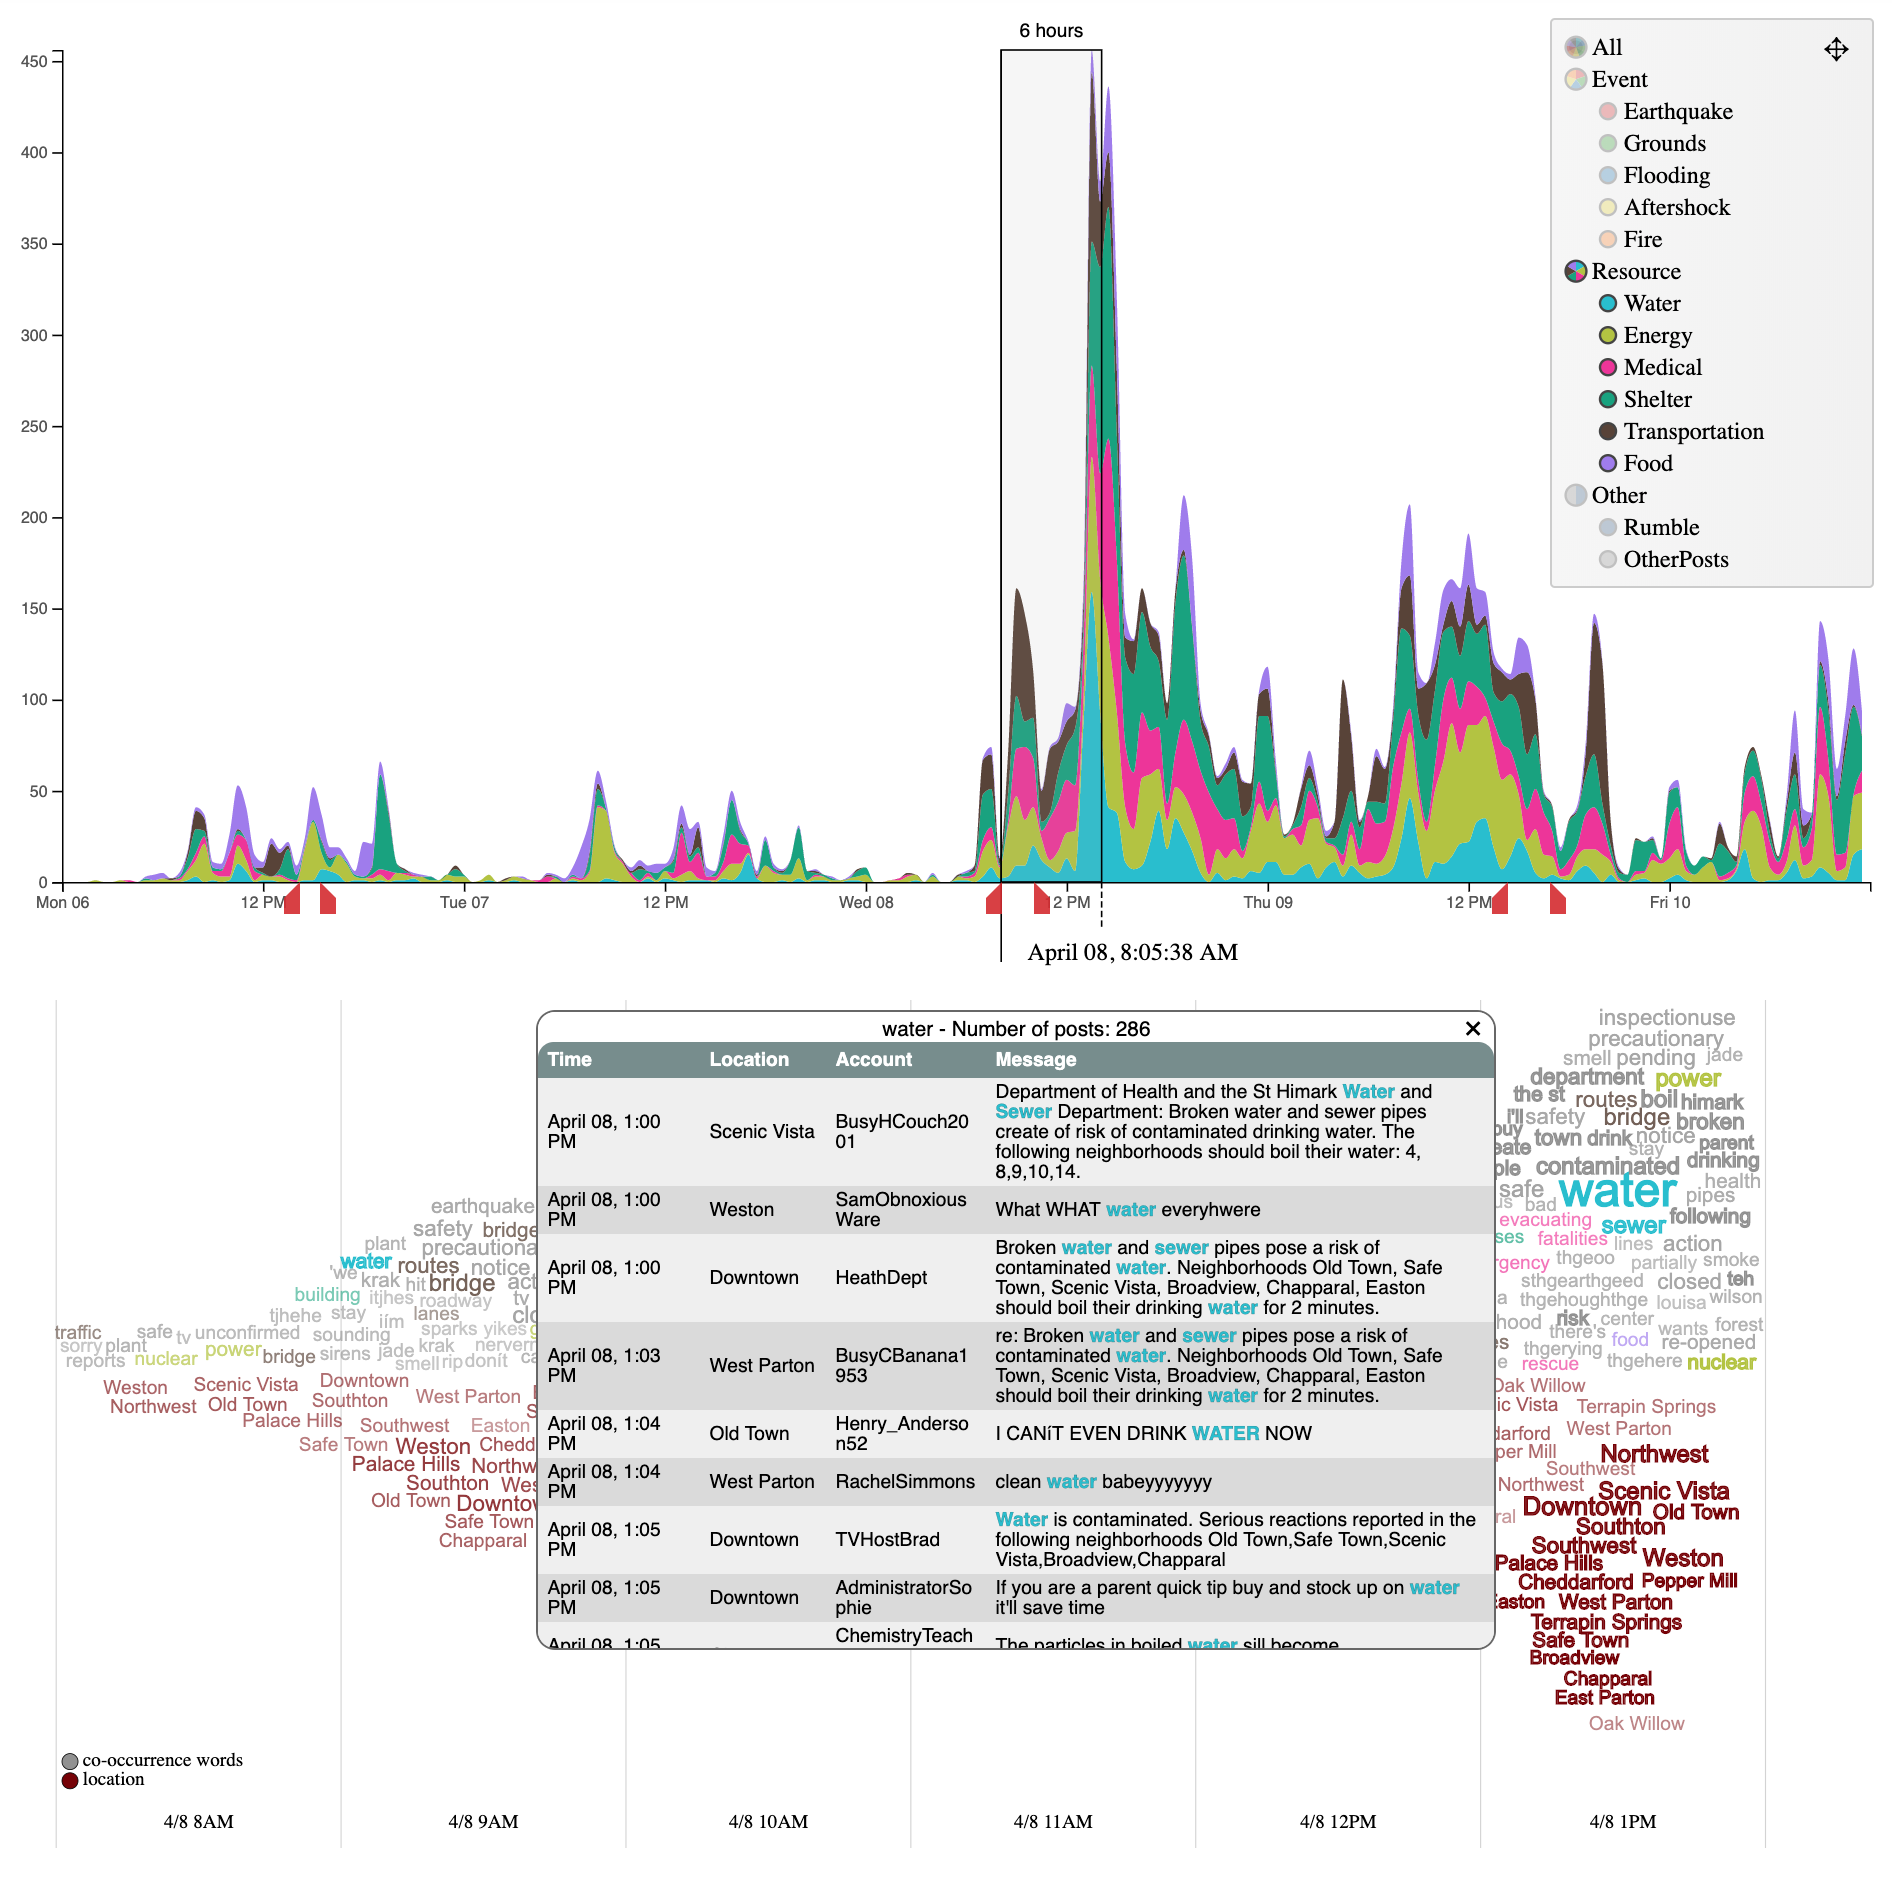
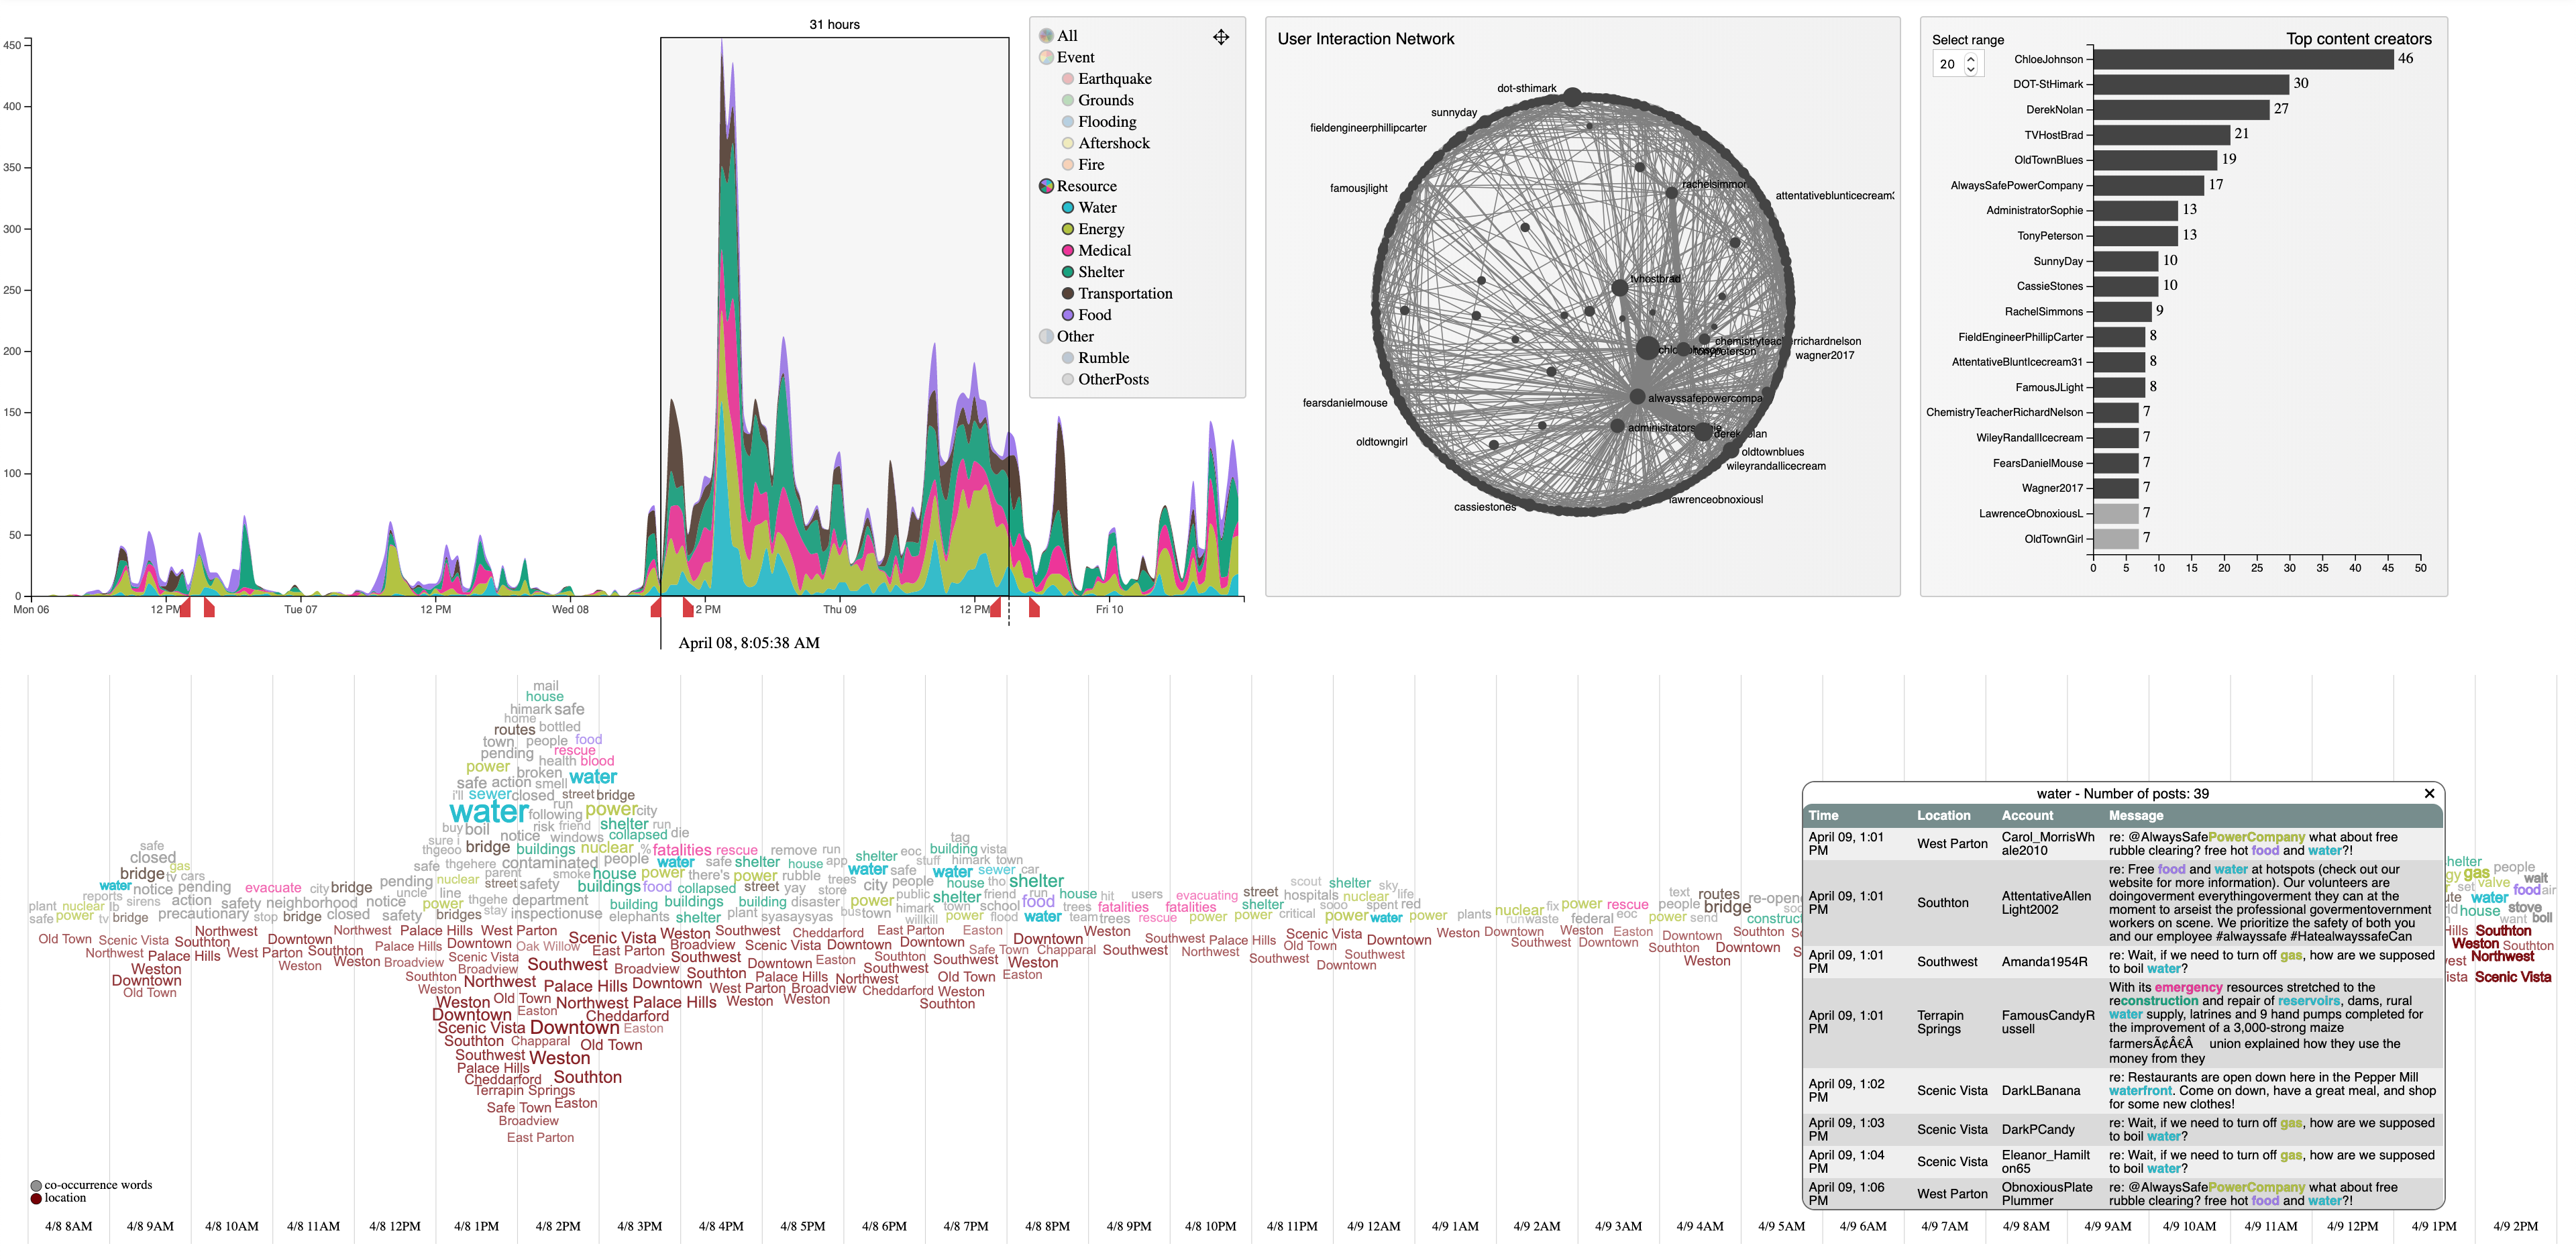
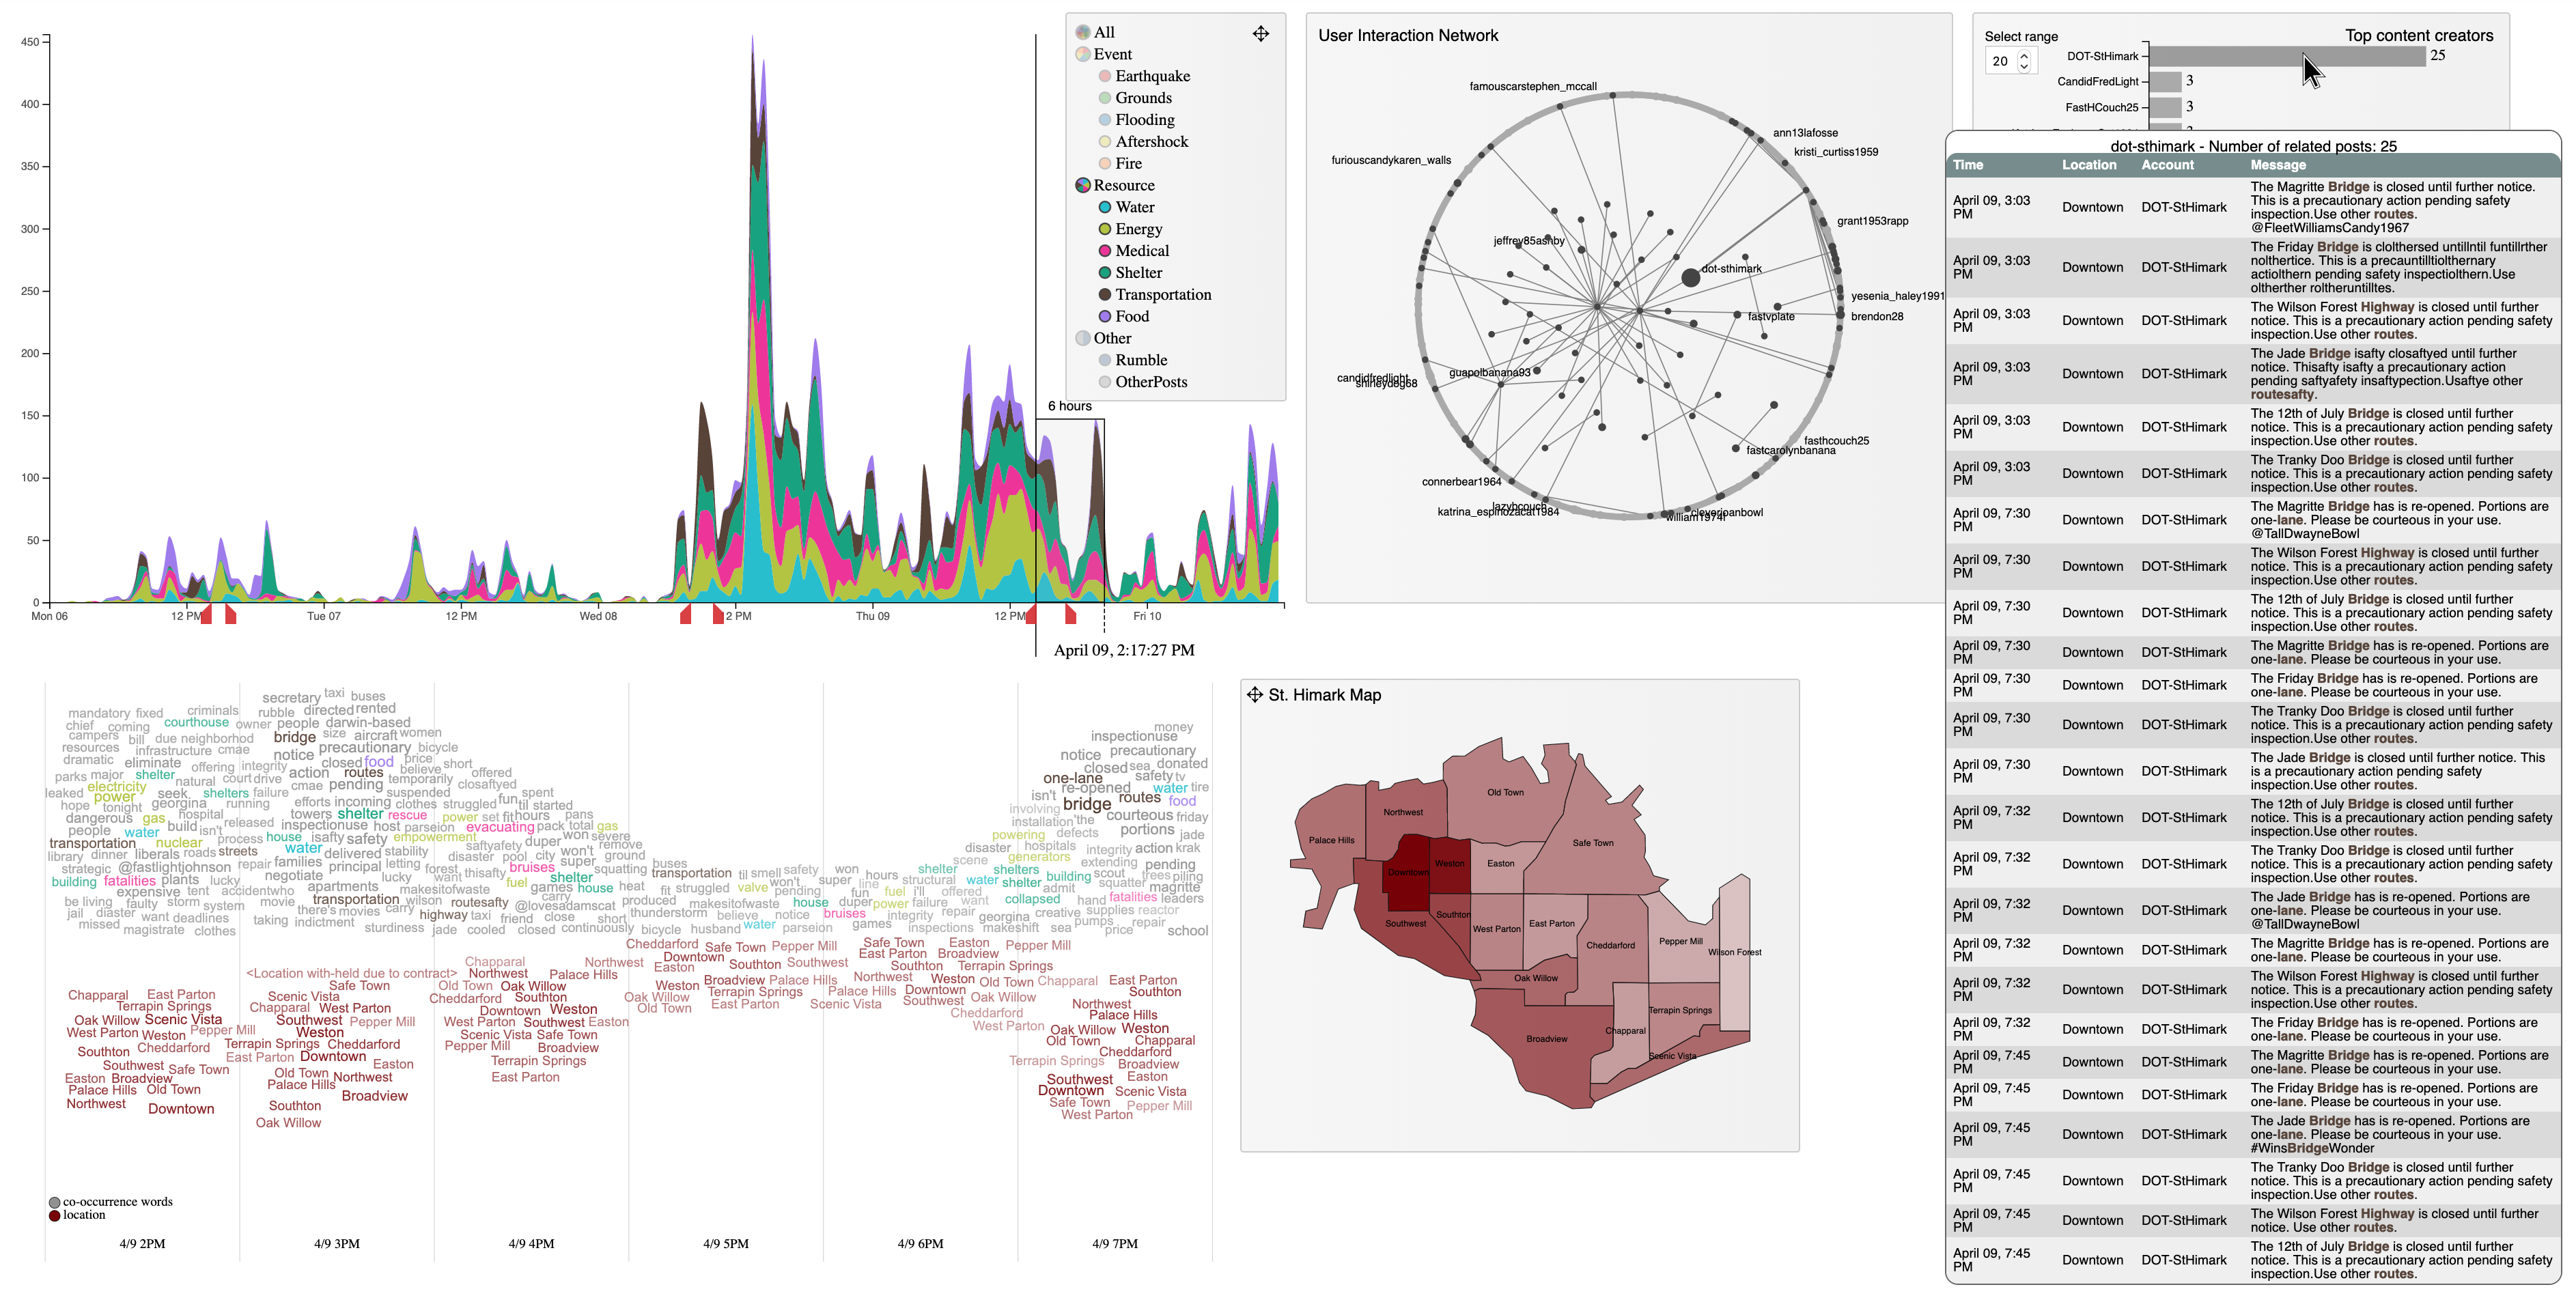
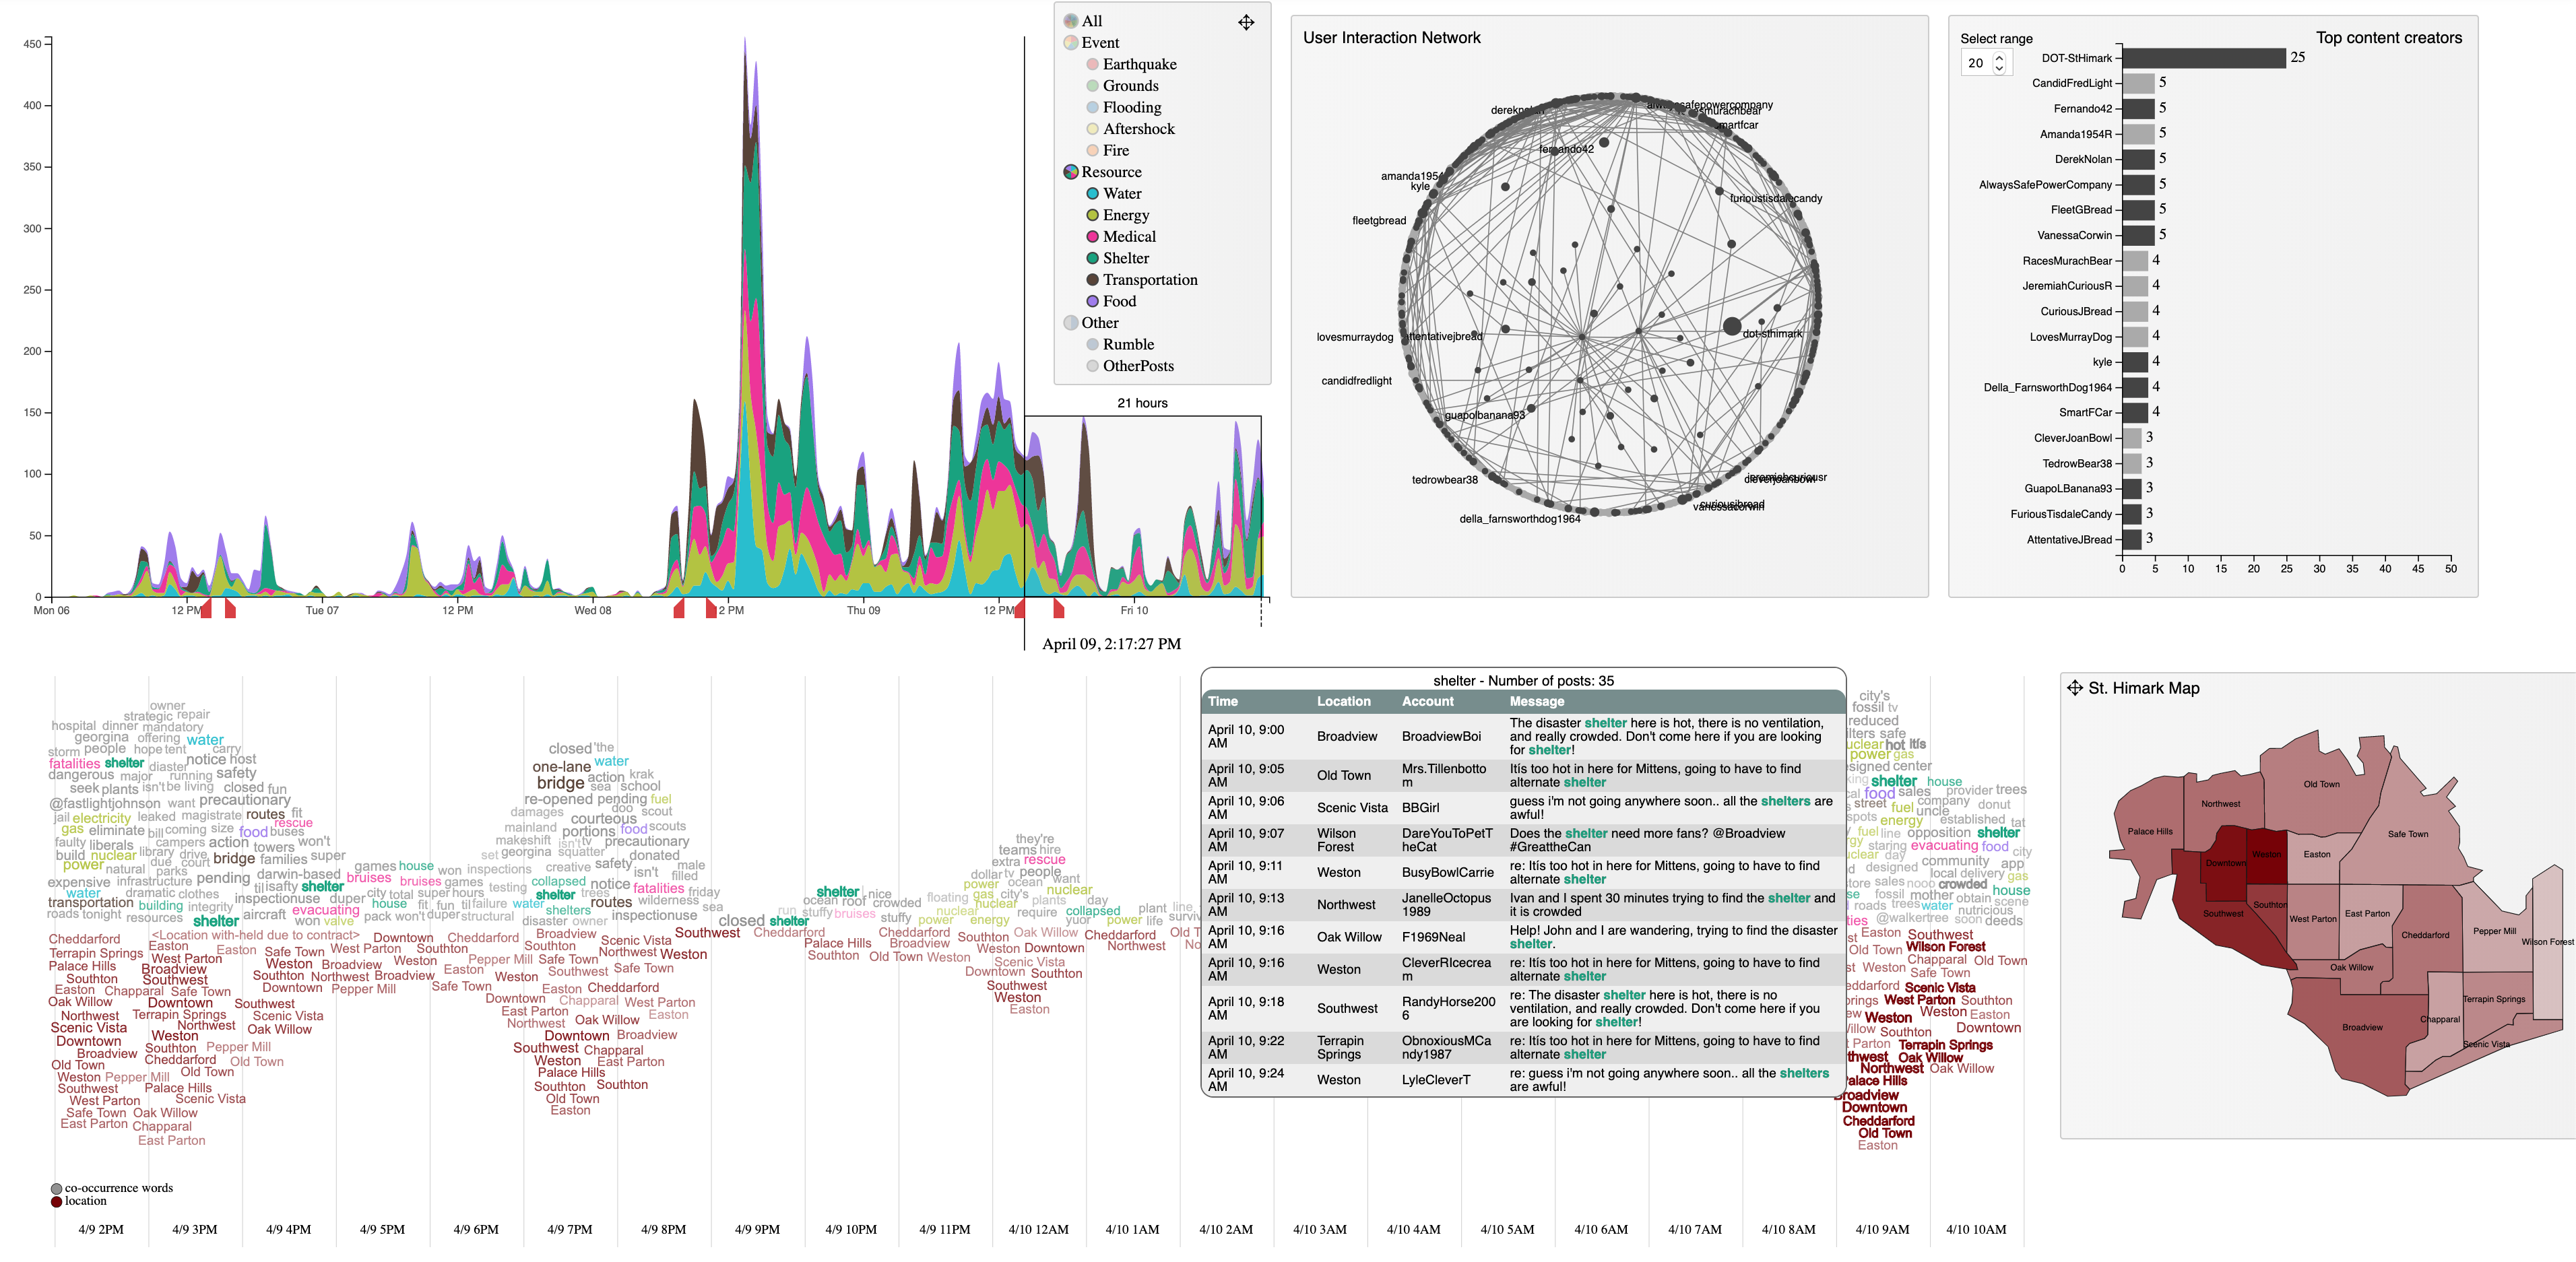
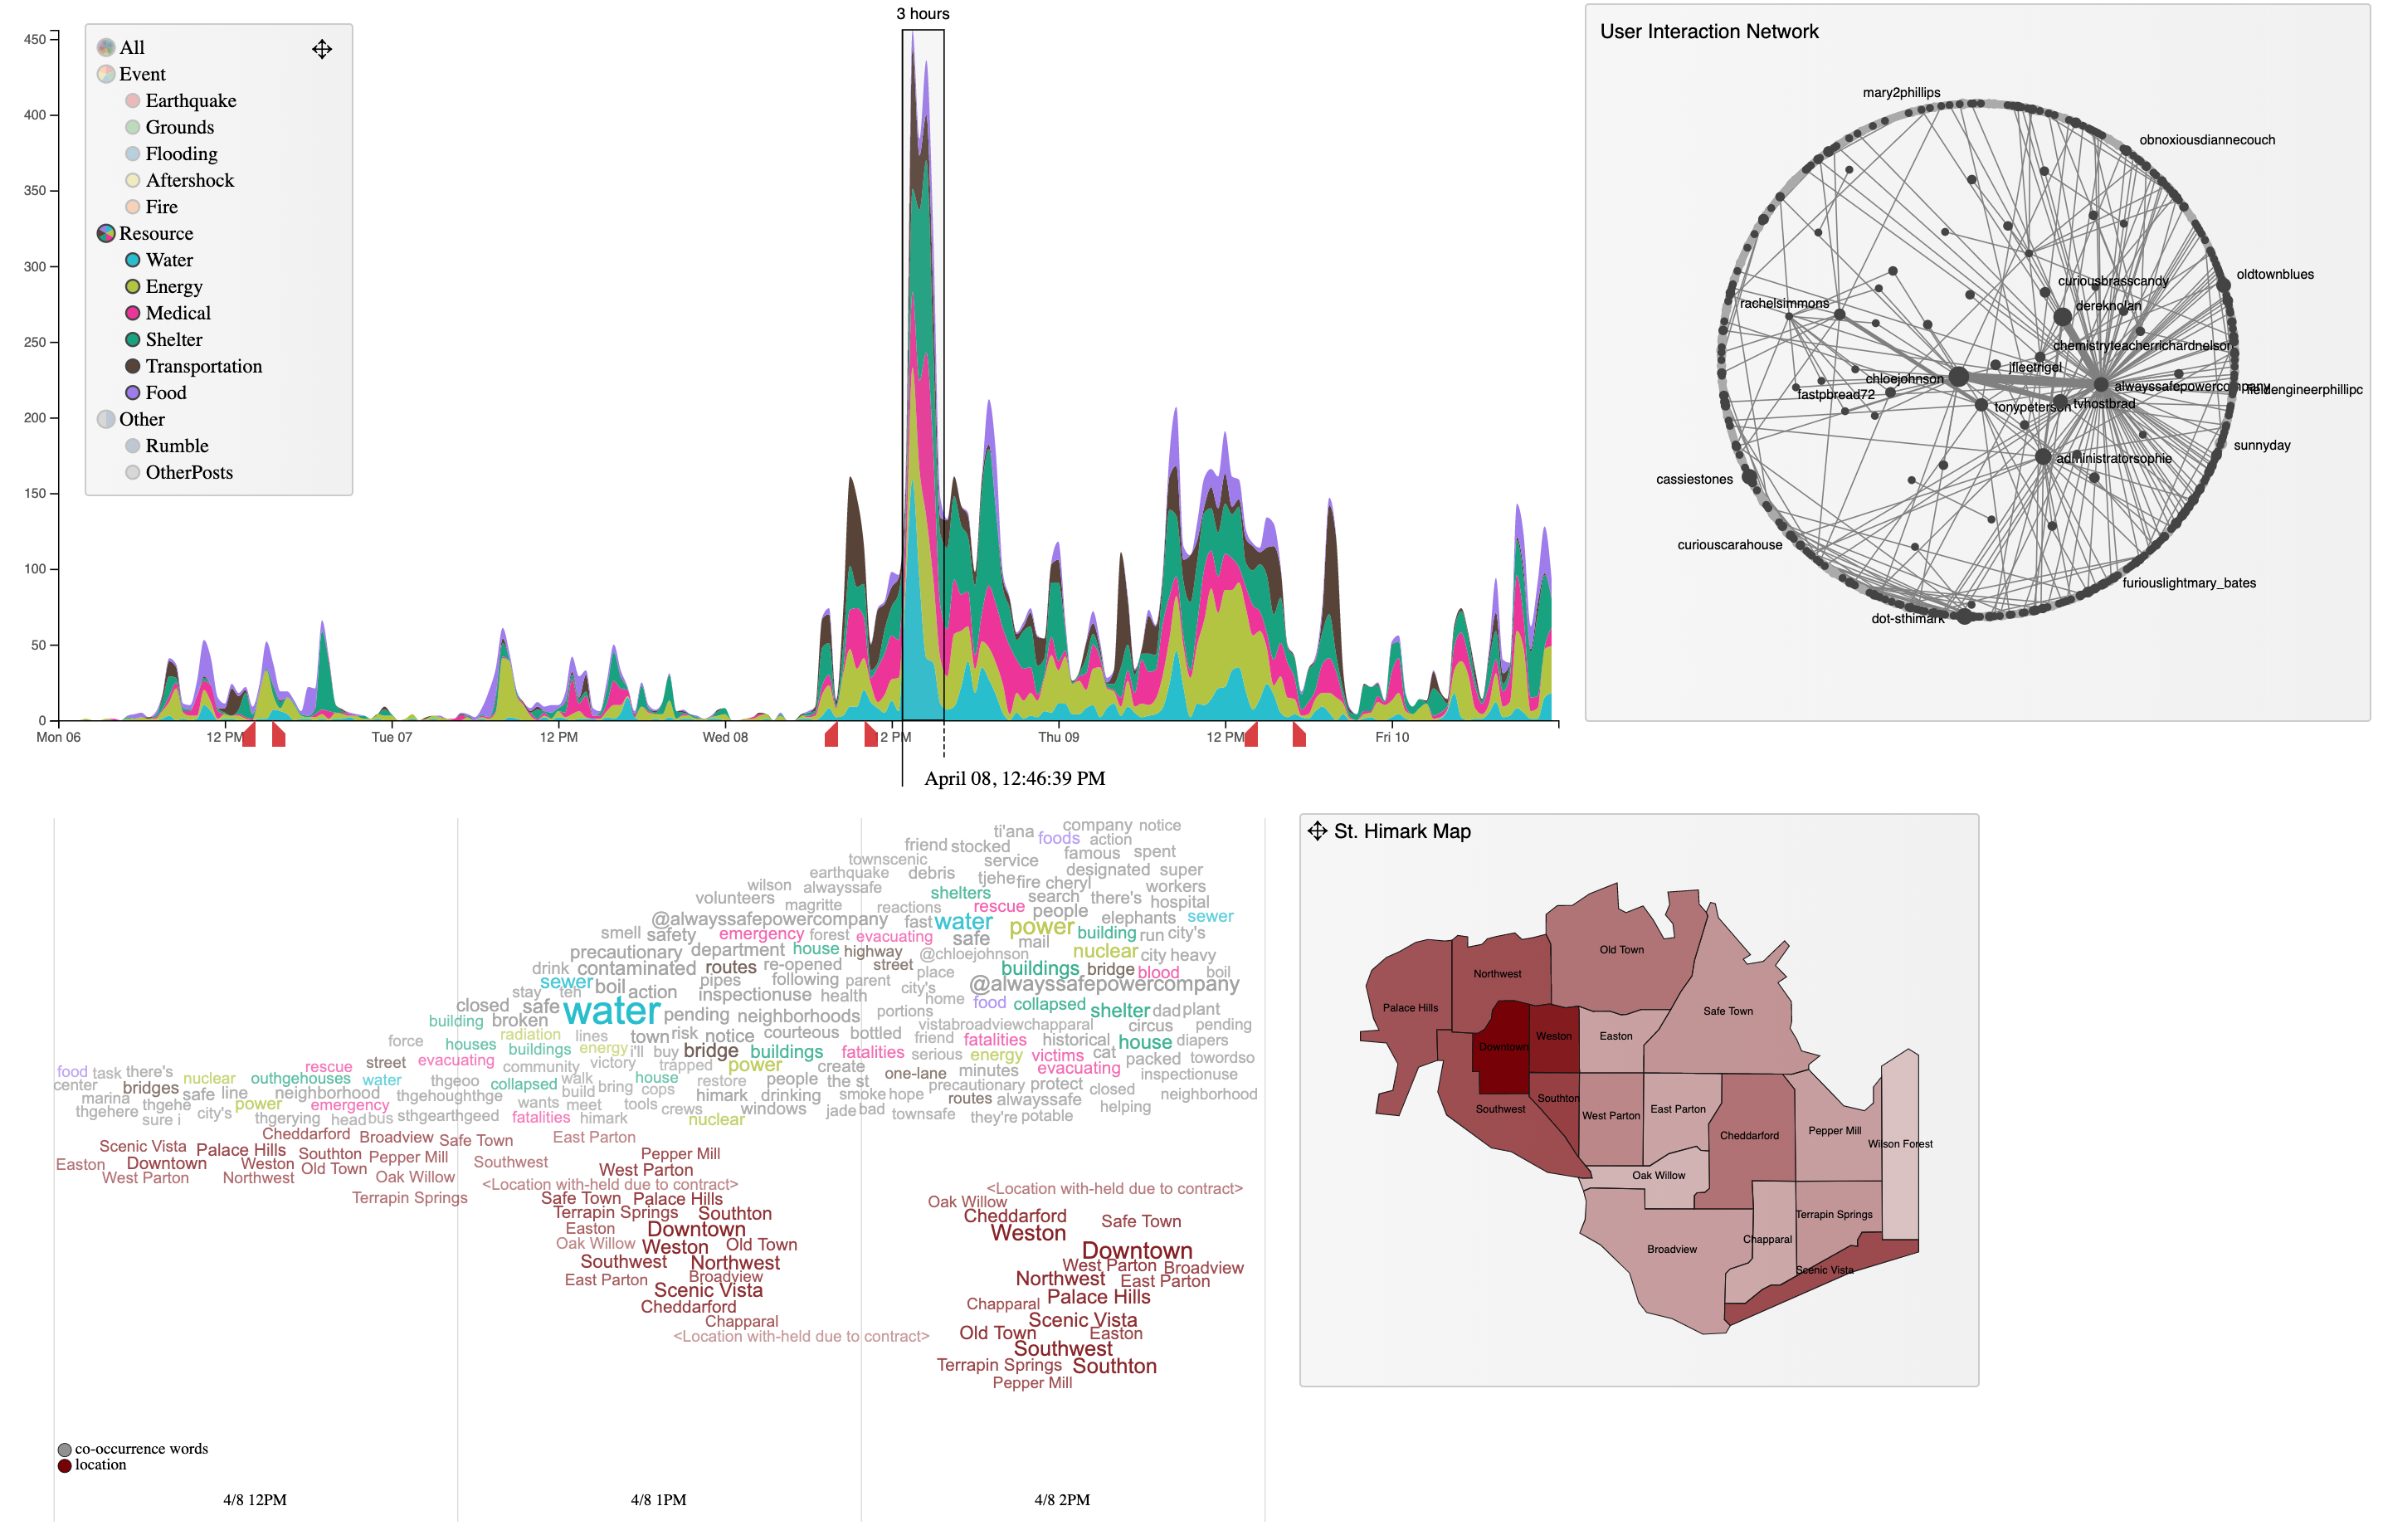
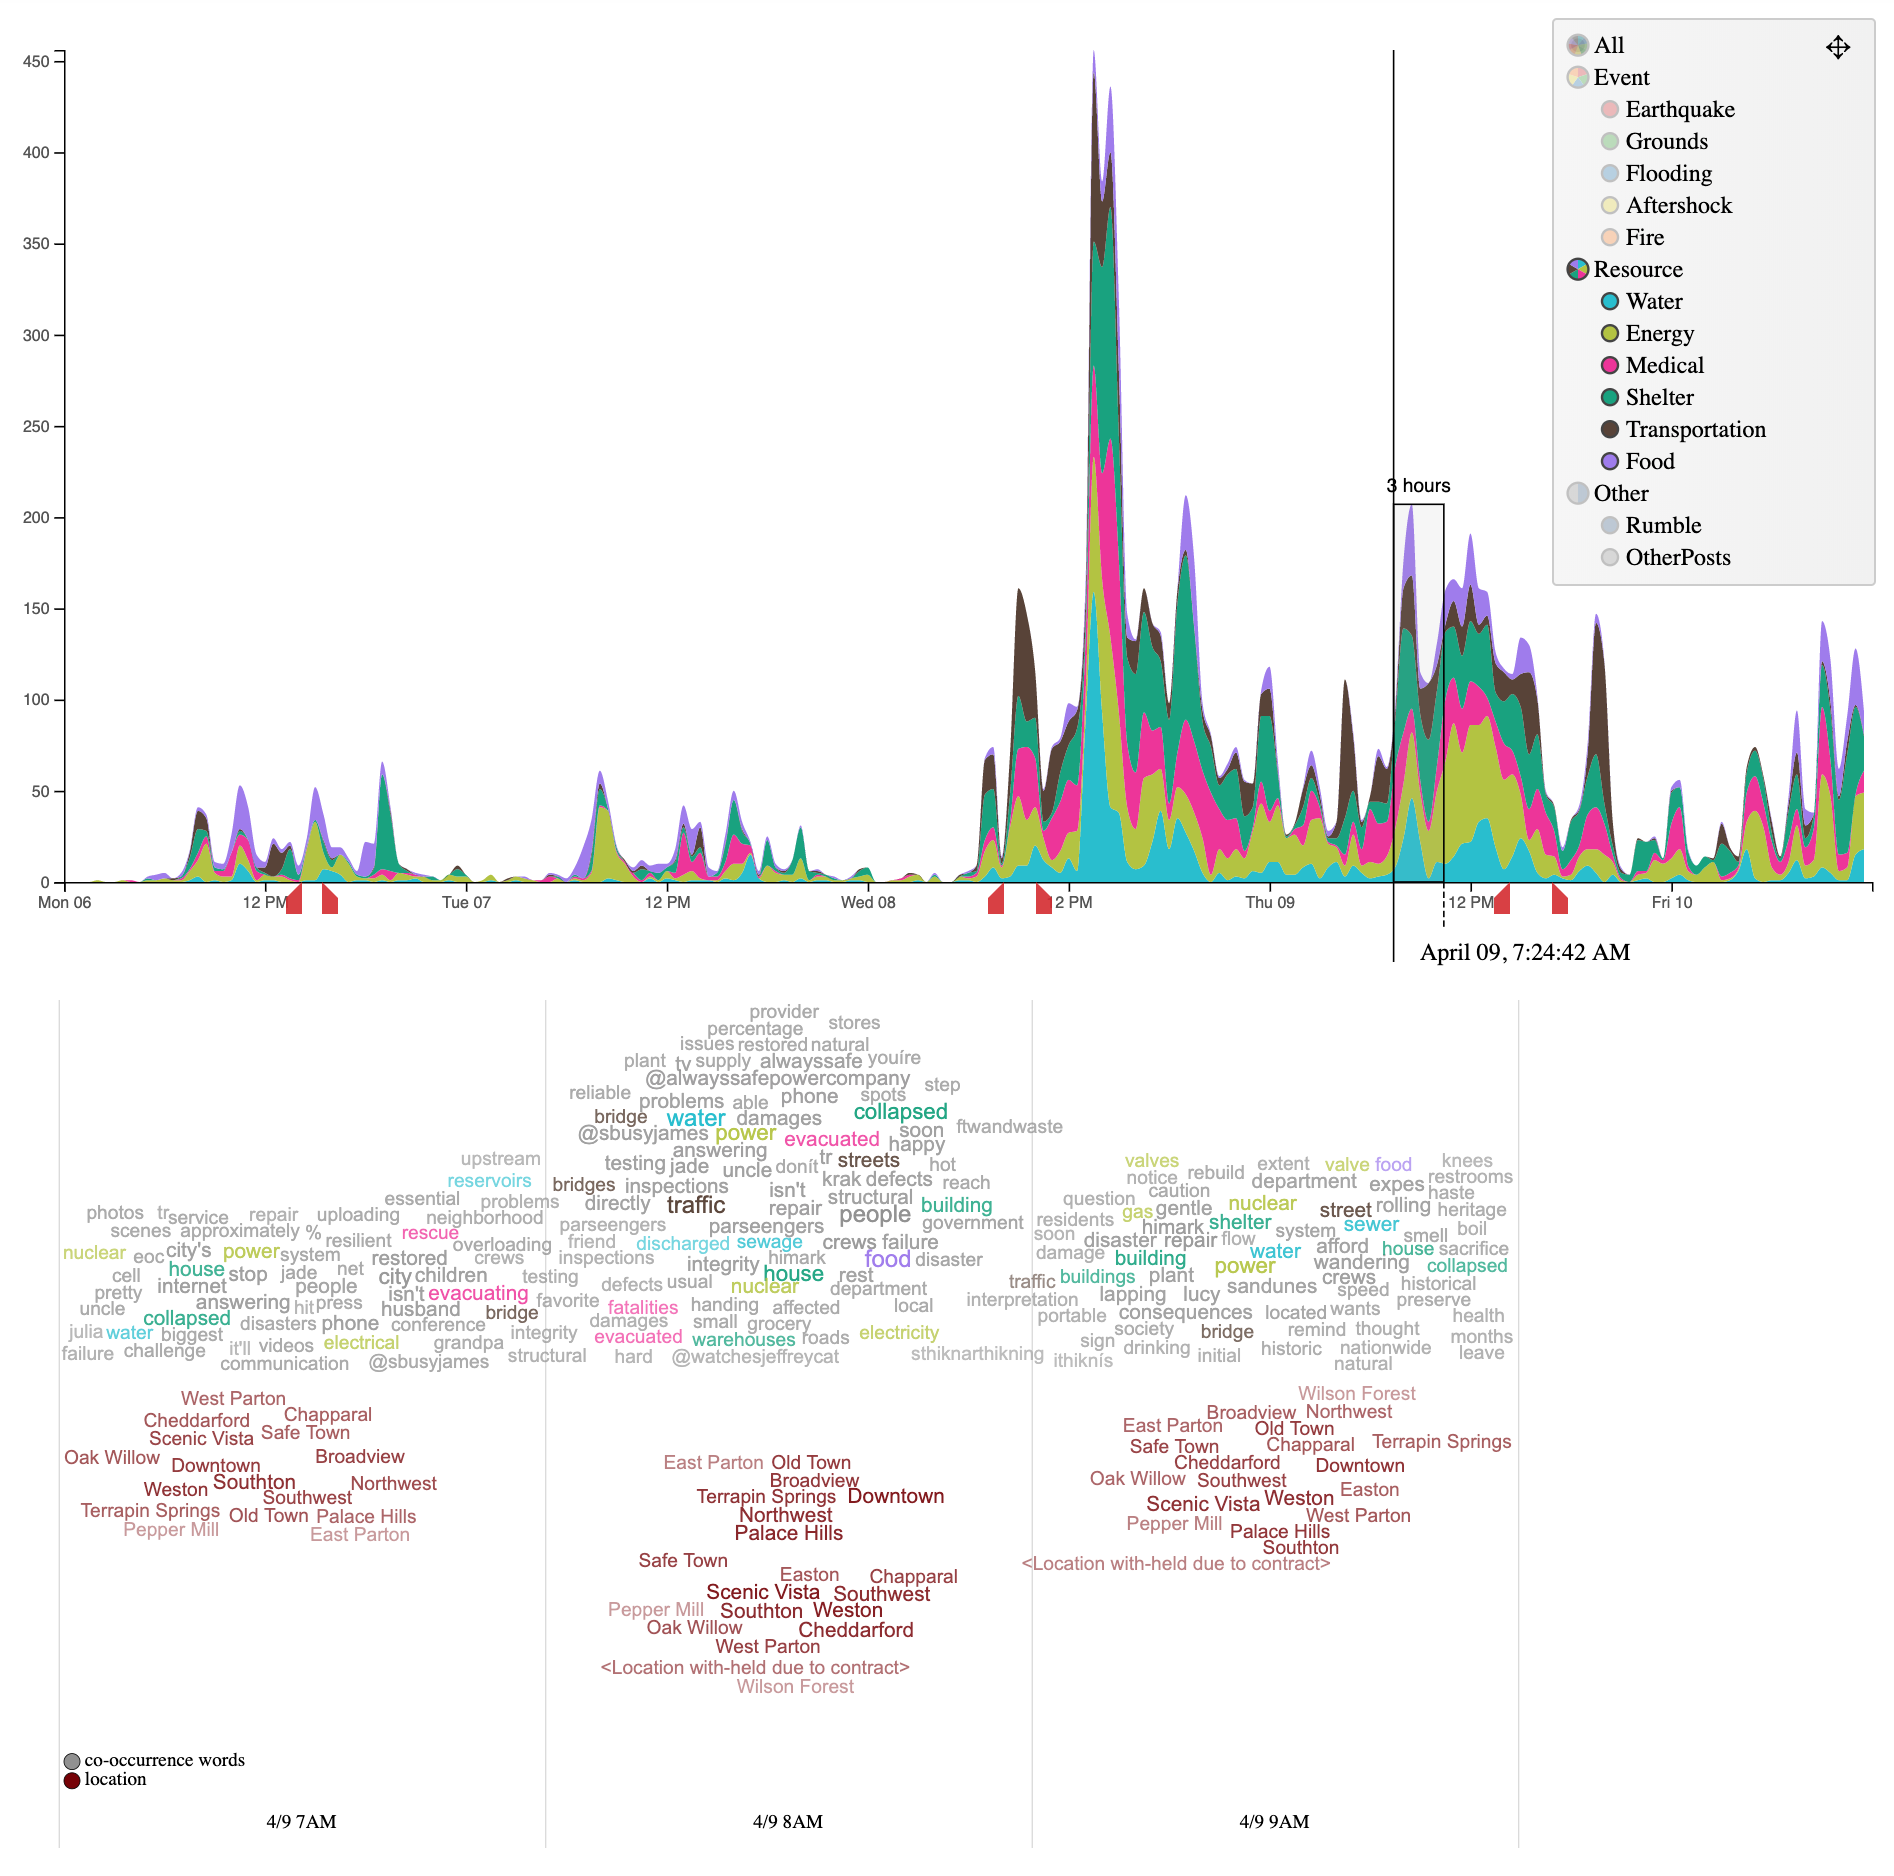
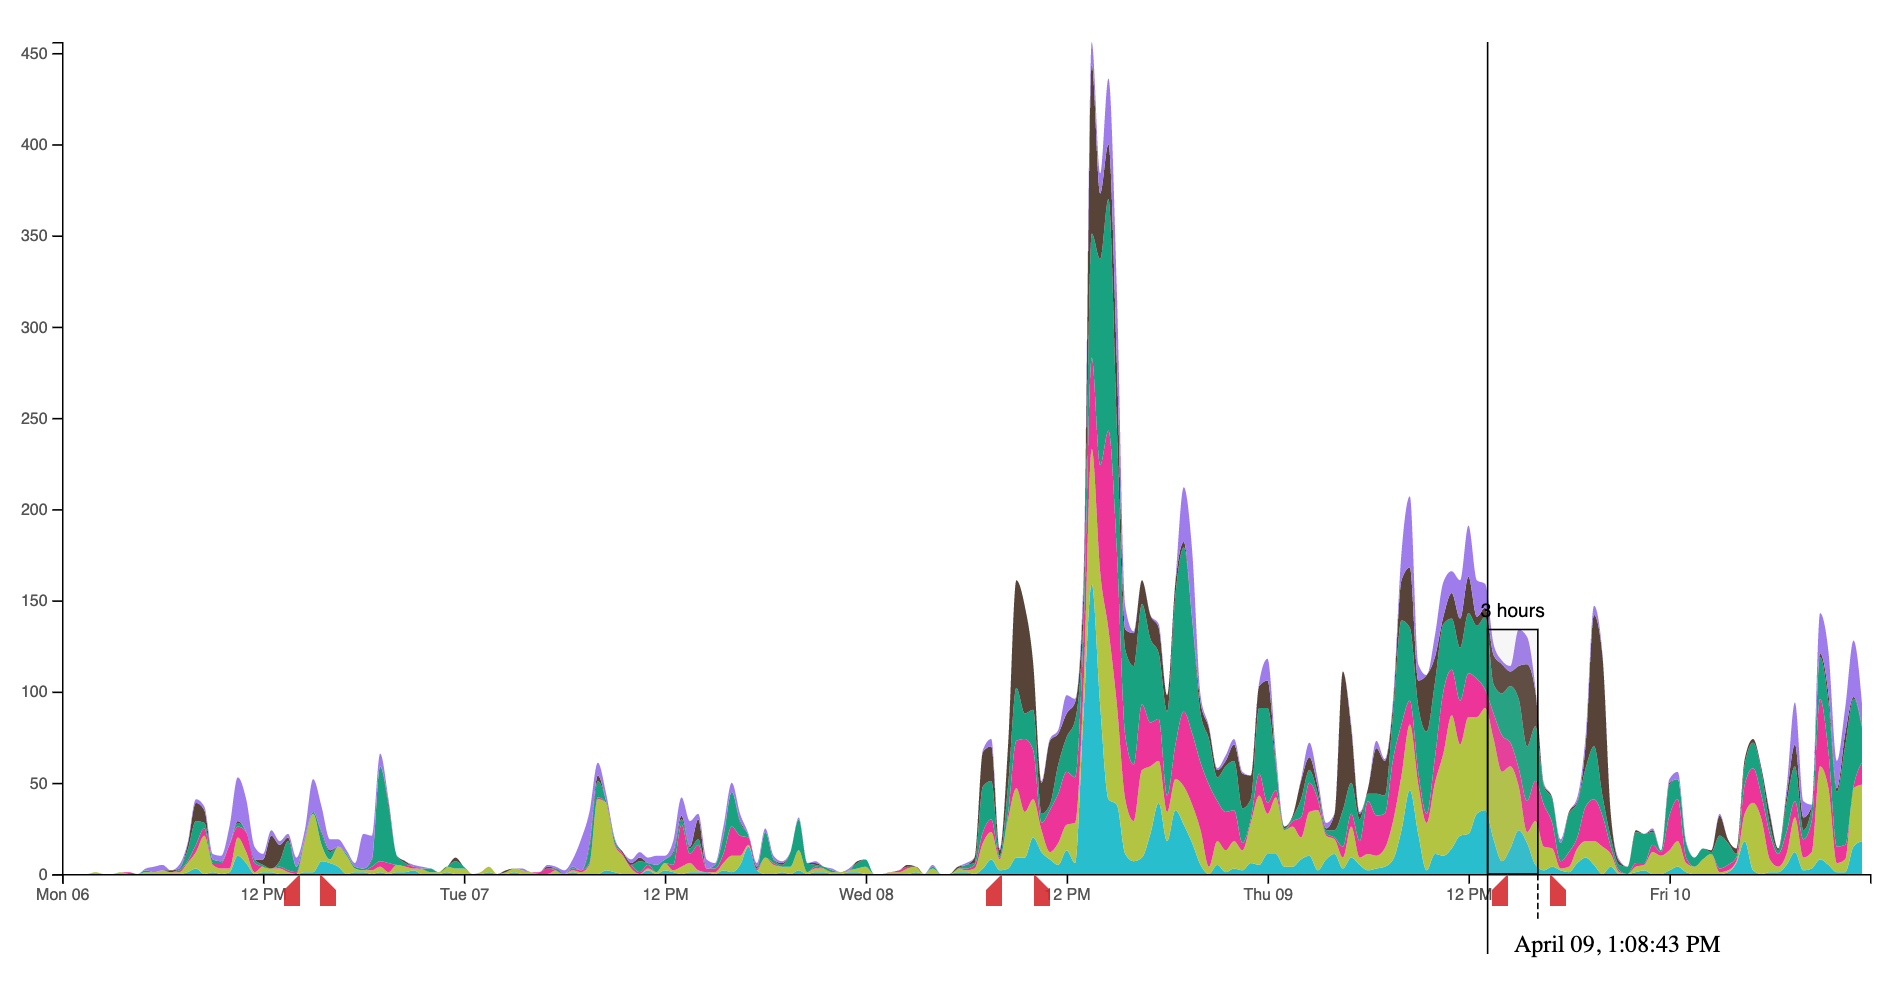
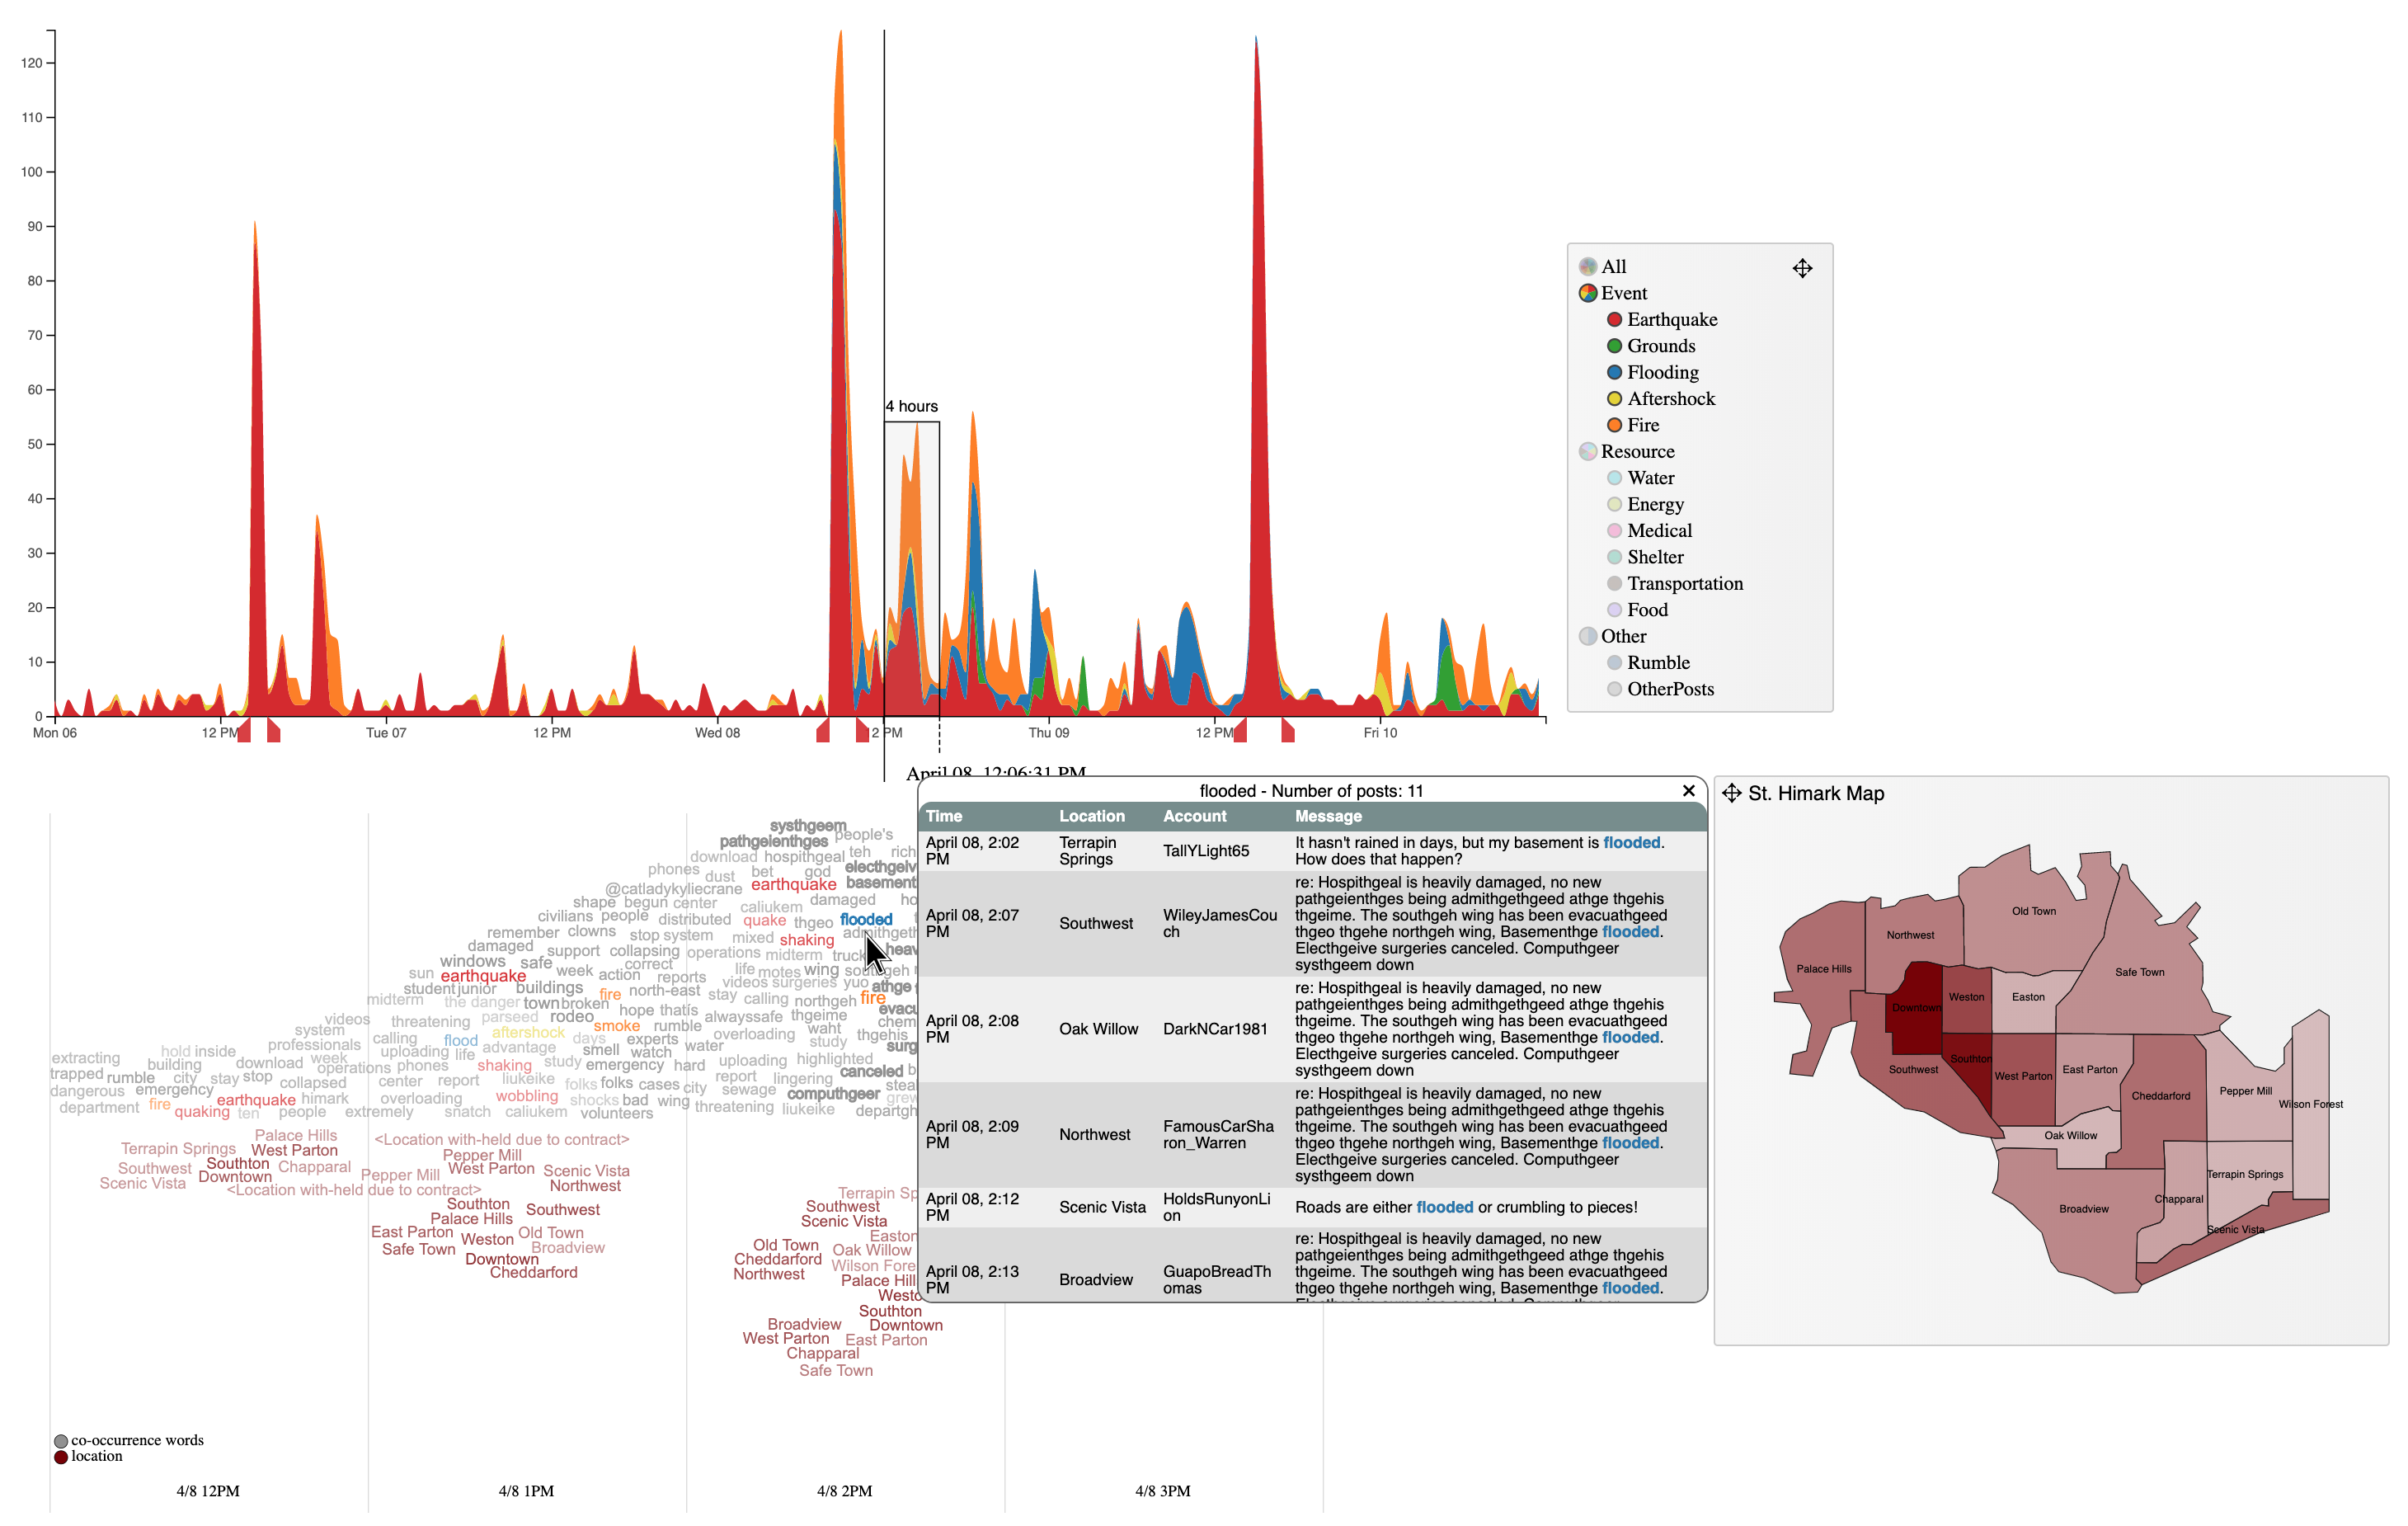
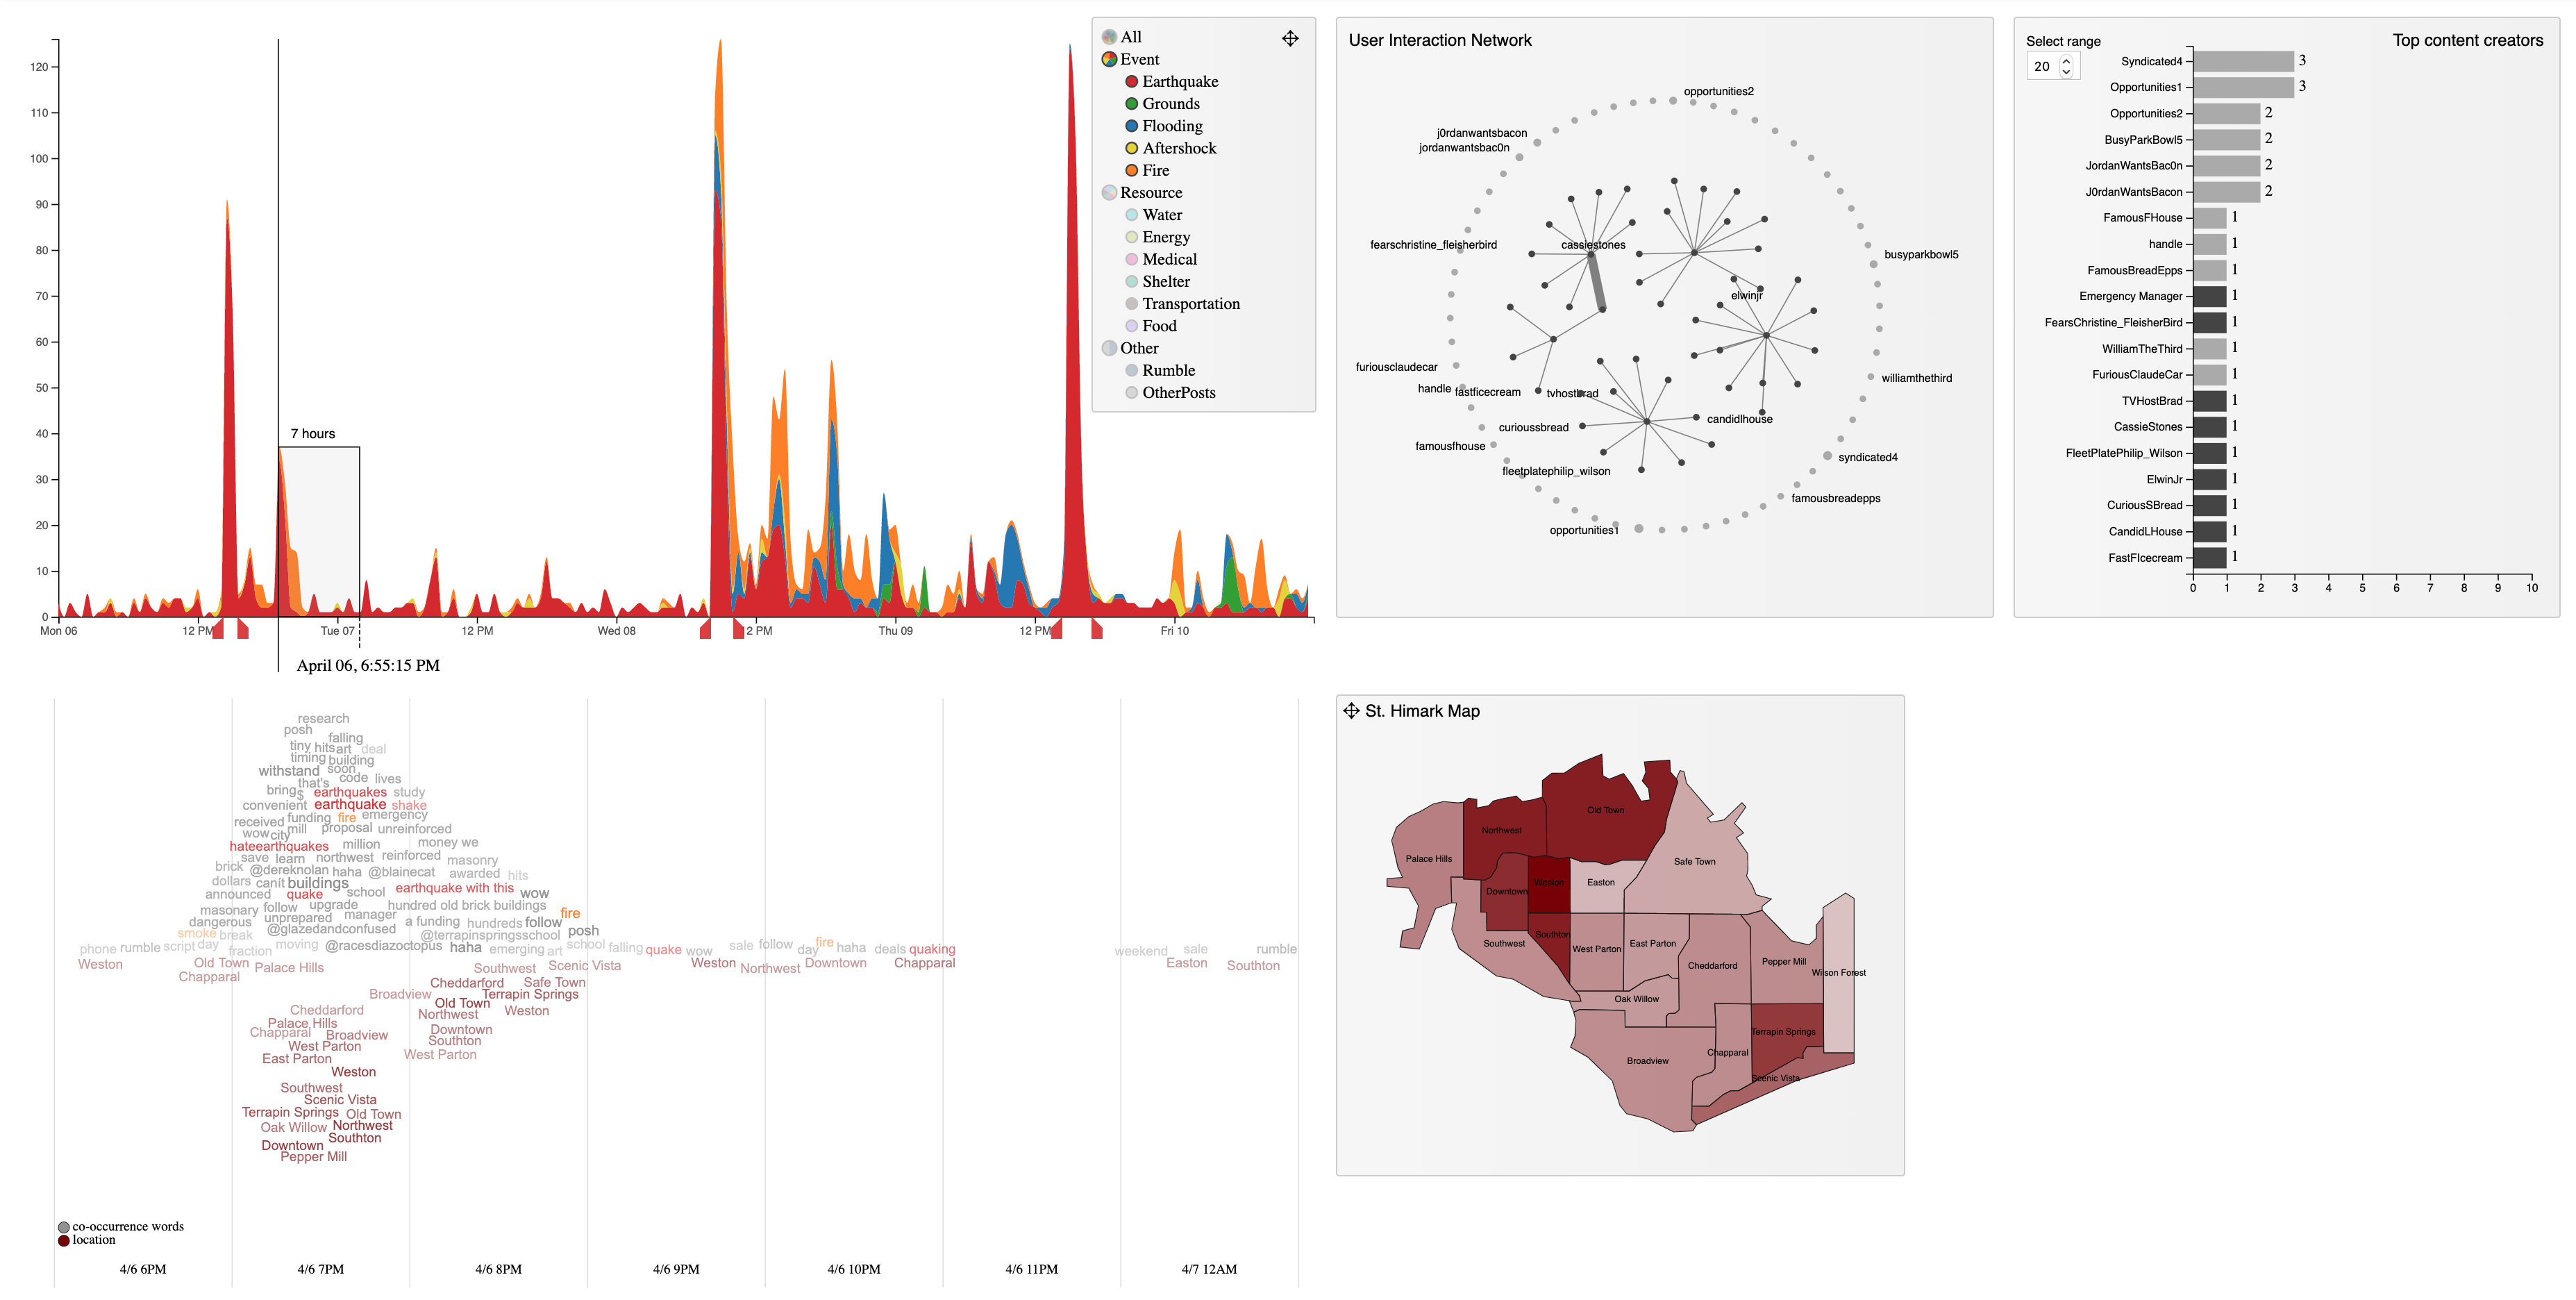
The analytics application includes active, interactive components that are able to work with dynamic, streaming data. The main control board (A) is built as a stream graph. Each stream represents the number of posts classified as the selected categories from selection panel (A1). Each of these categories come with a set of keywords to decide if a message belongs to a category or not. A sliding window across the stream graph is provided for specific selection of time frame at a particular timestamp, with expandable window width. This time frame can be expanded from 1 hour to 31 hours by user. The vertical axis shows the number of posts, while the horizontal axis shows the timeline.

The other four components are depicted as panels B to E in System Overview Figure. For each change in main panel A – whether it is choosing another time frame, timestamp or category selection, all other 4 panels are updated according to A.

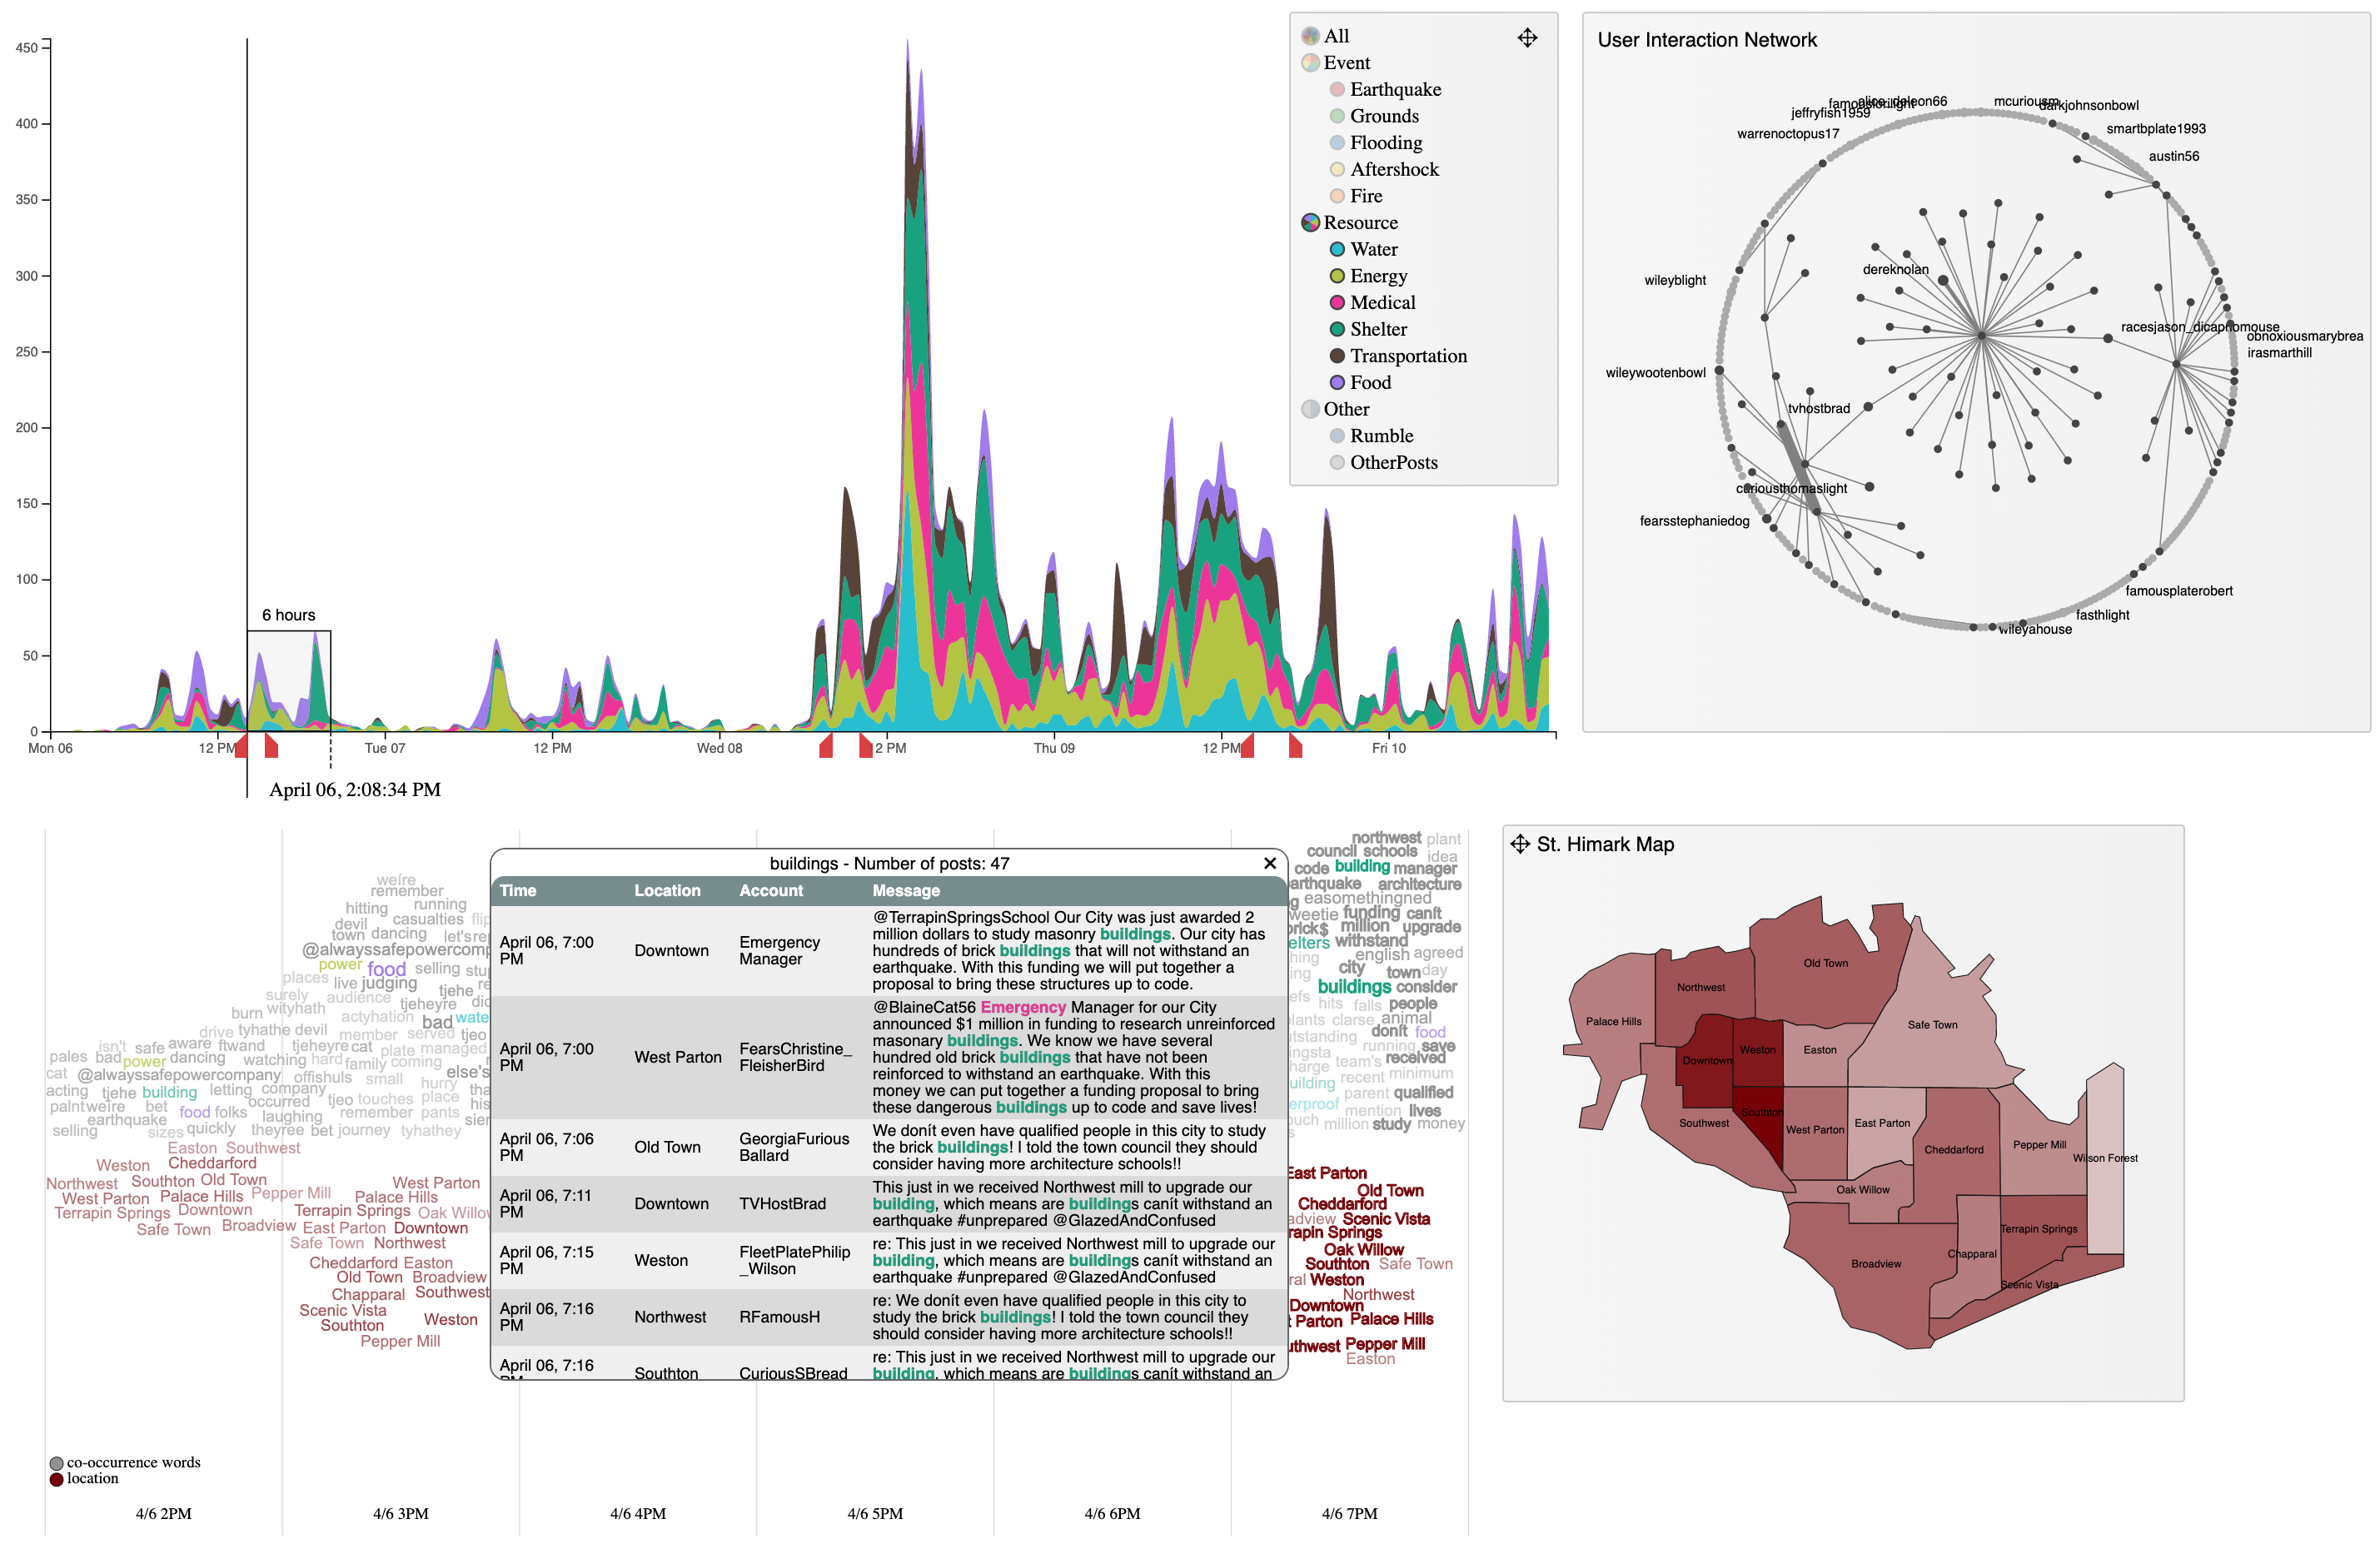
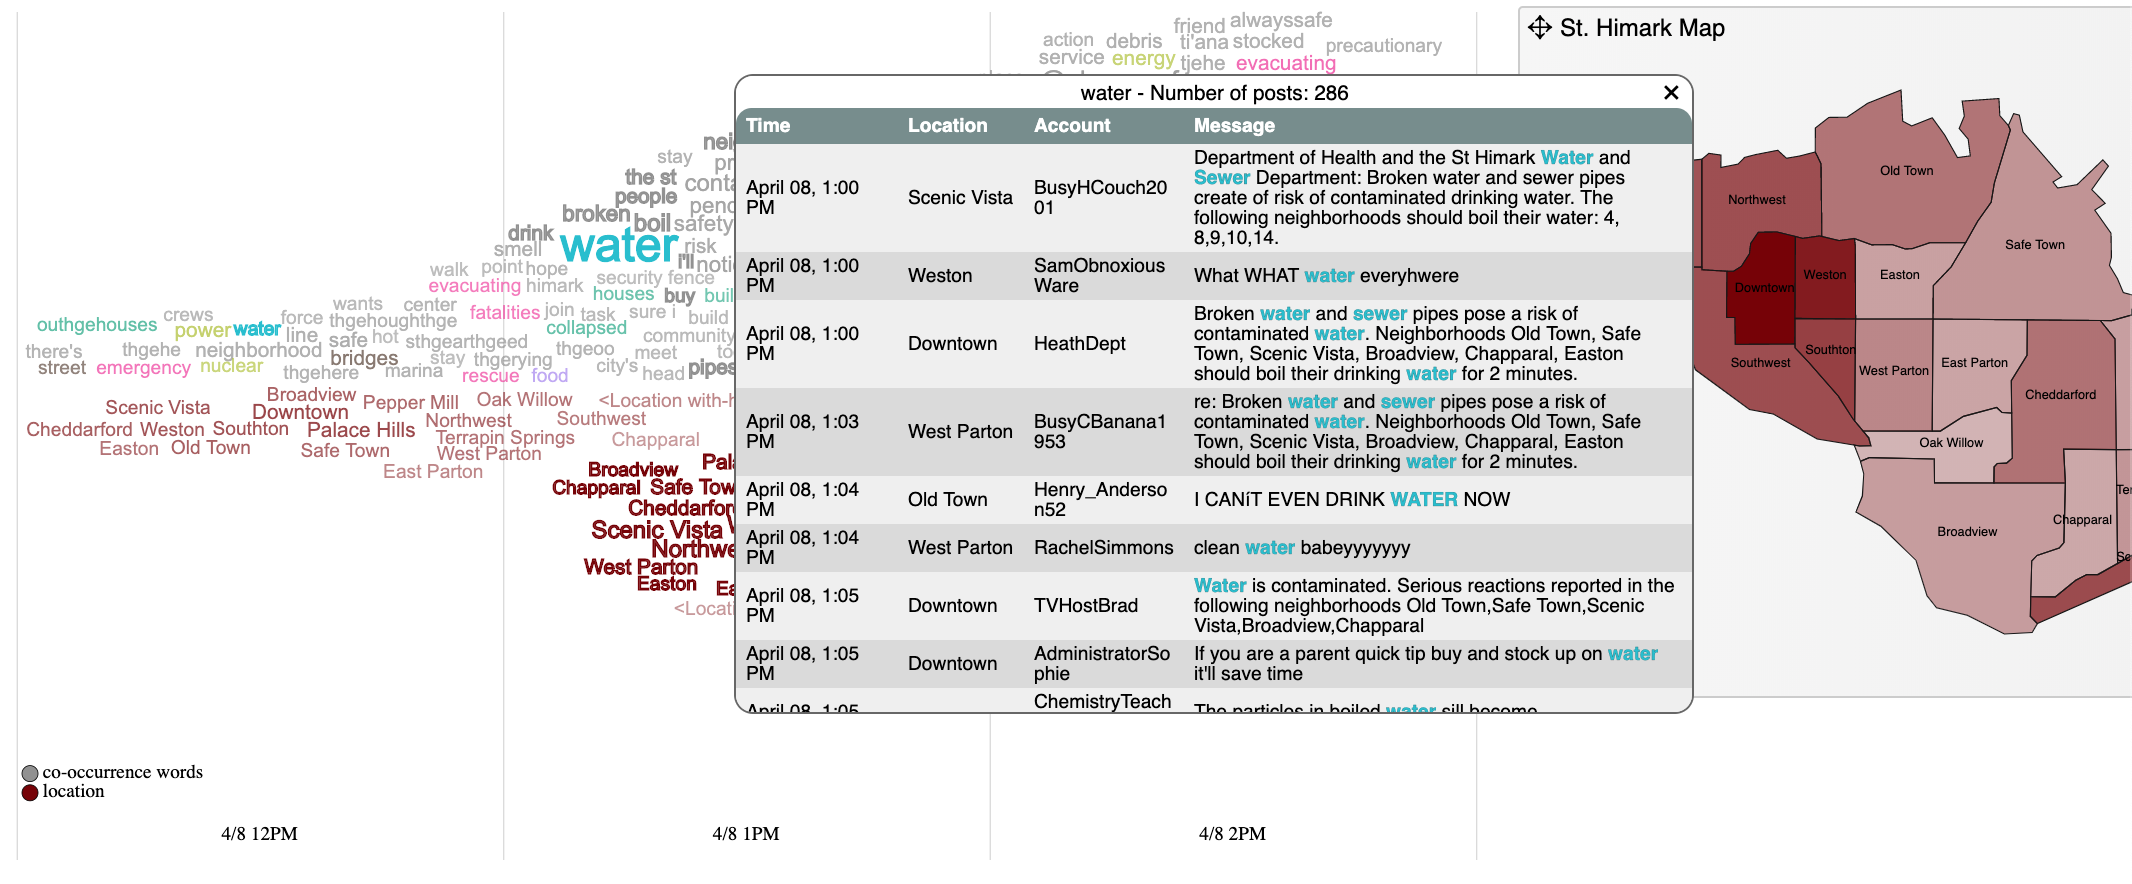
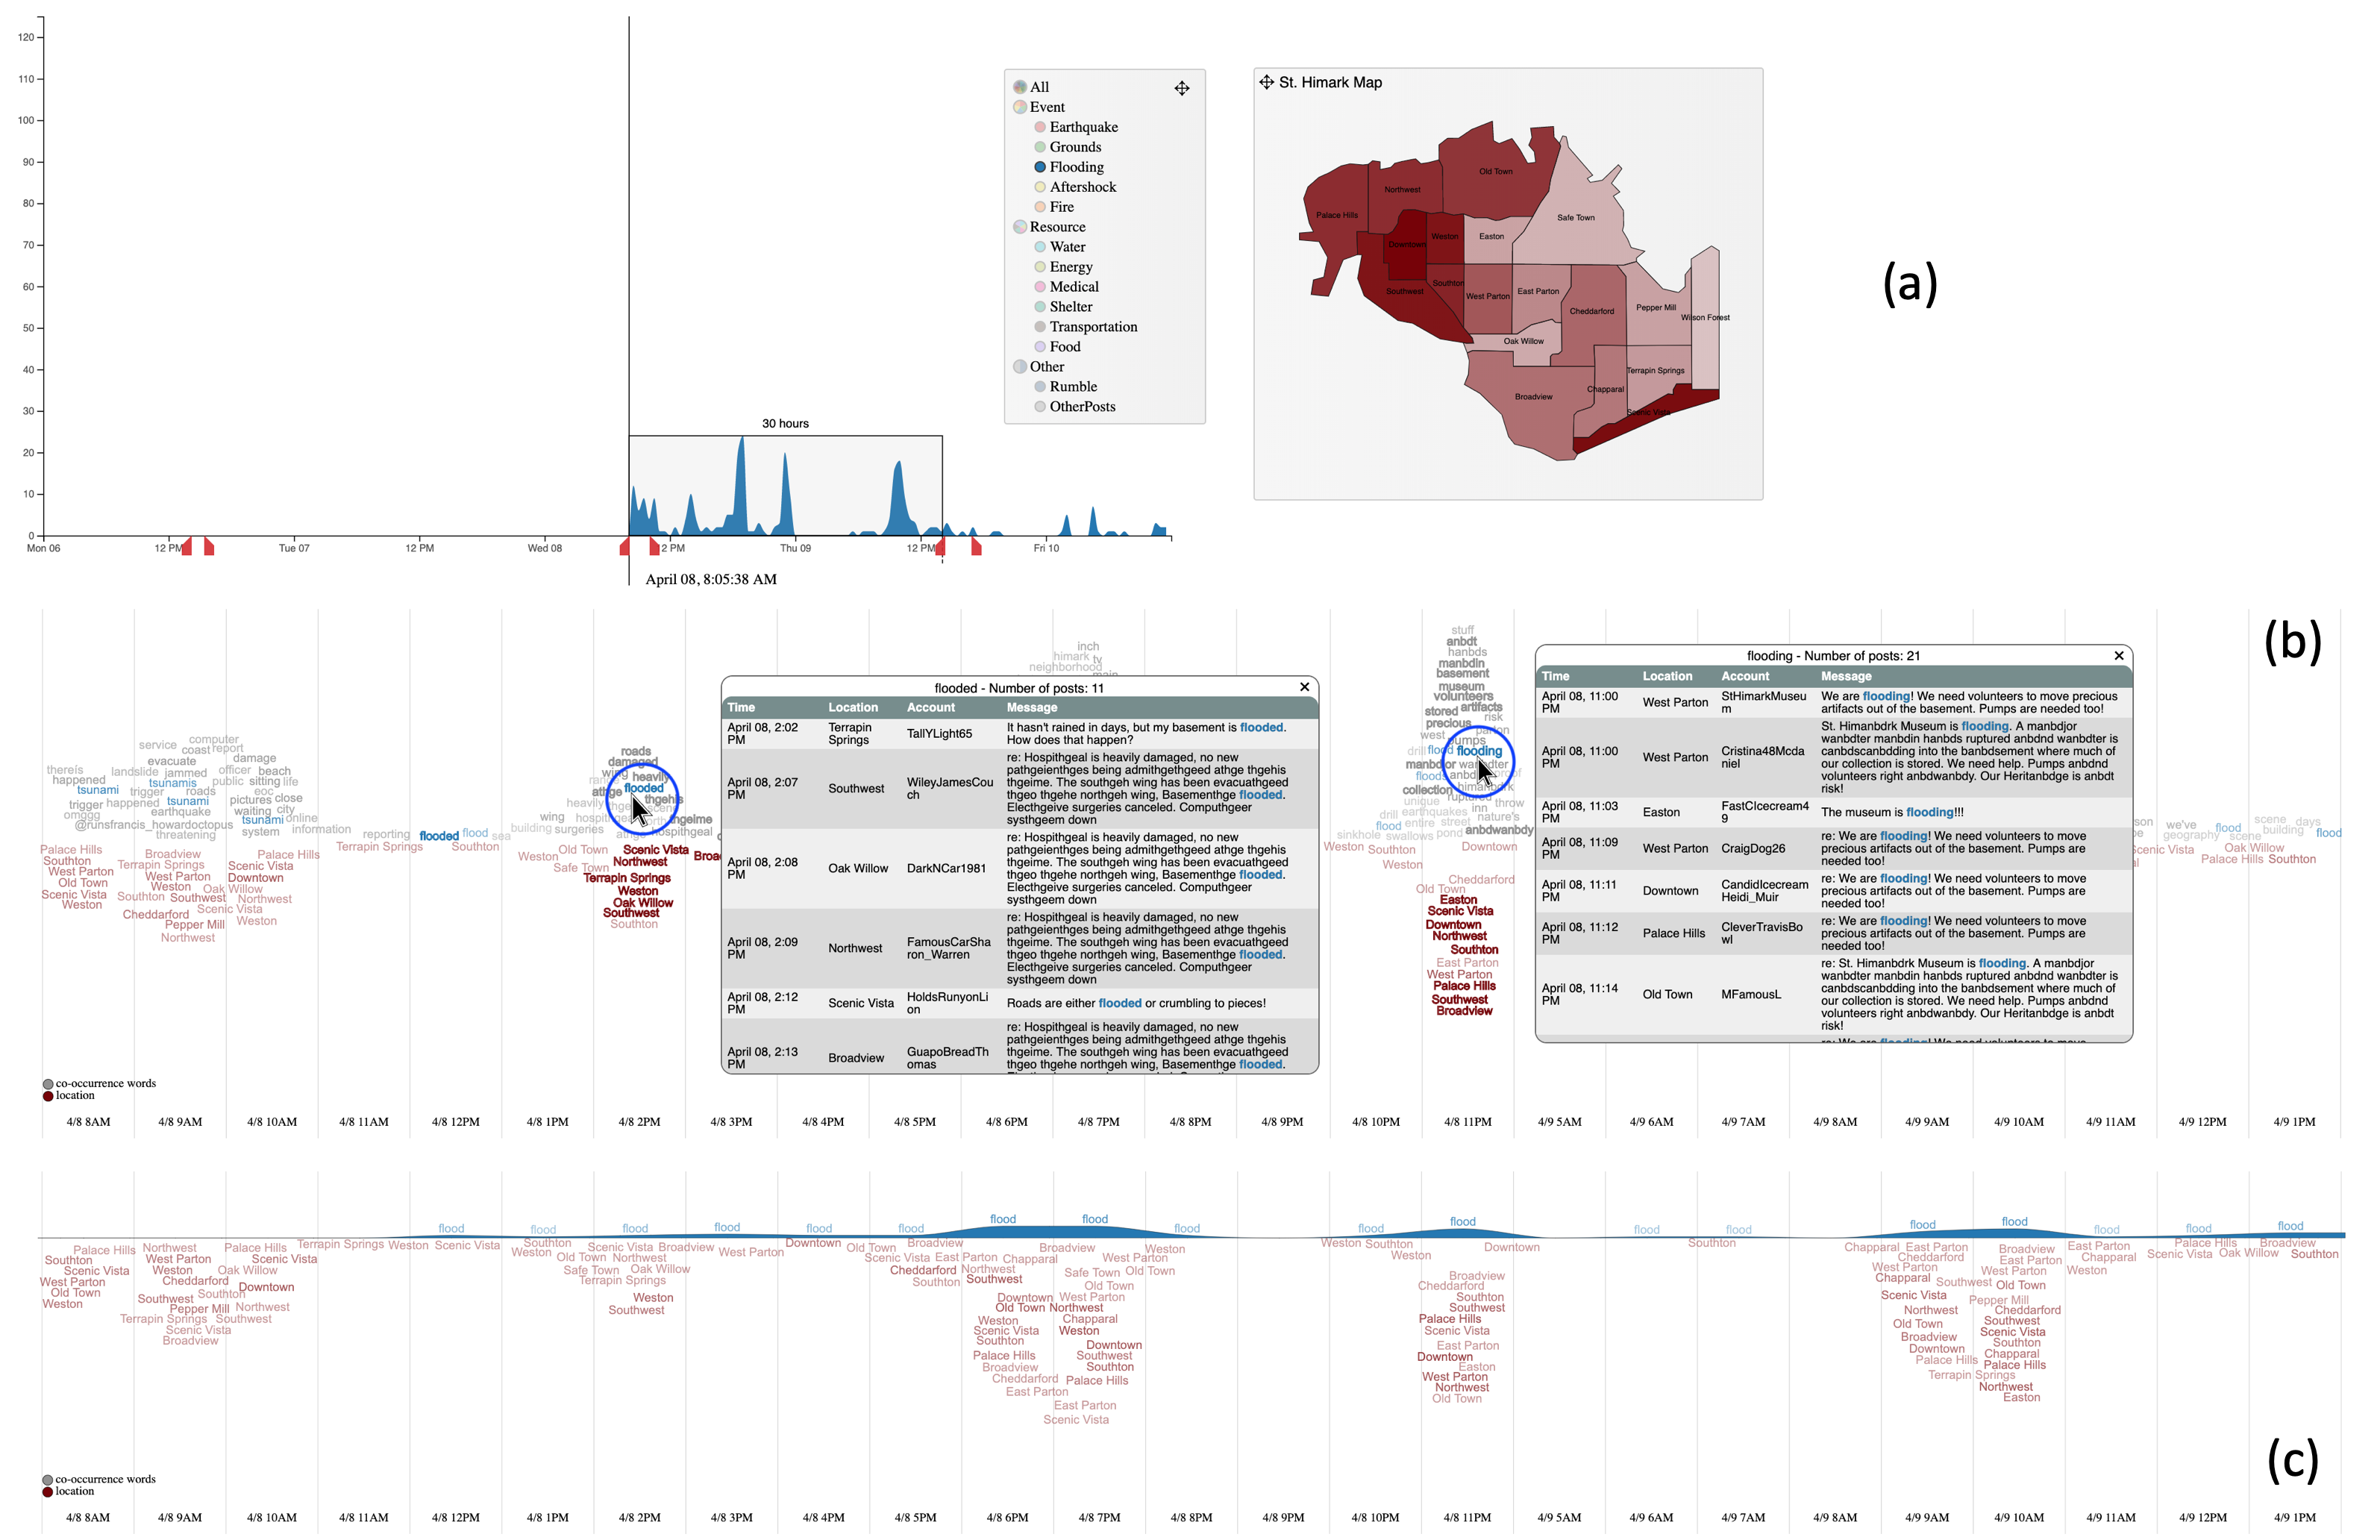
To demonstrate the evolution of a topic, panel B provides a WordStream, showcasing the content of corresponding messages for the chosen time frame and the chosen categories. The WordStream consists of two topics: the keywords within content of messages and location of the message. Thickness of the stream is proportional to number of posts – the global trend. Users can also explore the local trend of an individual term and detail of messages.

Panel C is a map of St. Himark, in which the color of each neighborhood indicates the number of posts for the chosen time frame and the chosen categories. User can use this map for highlighting corresponding terms in the WordStream and vice versa.

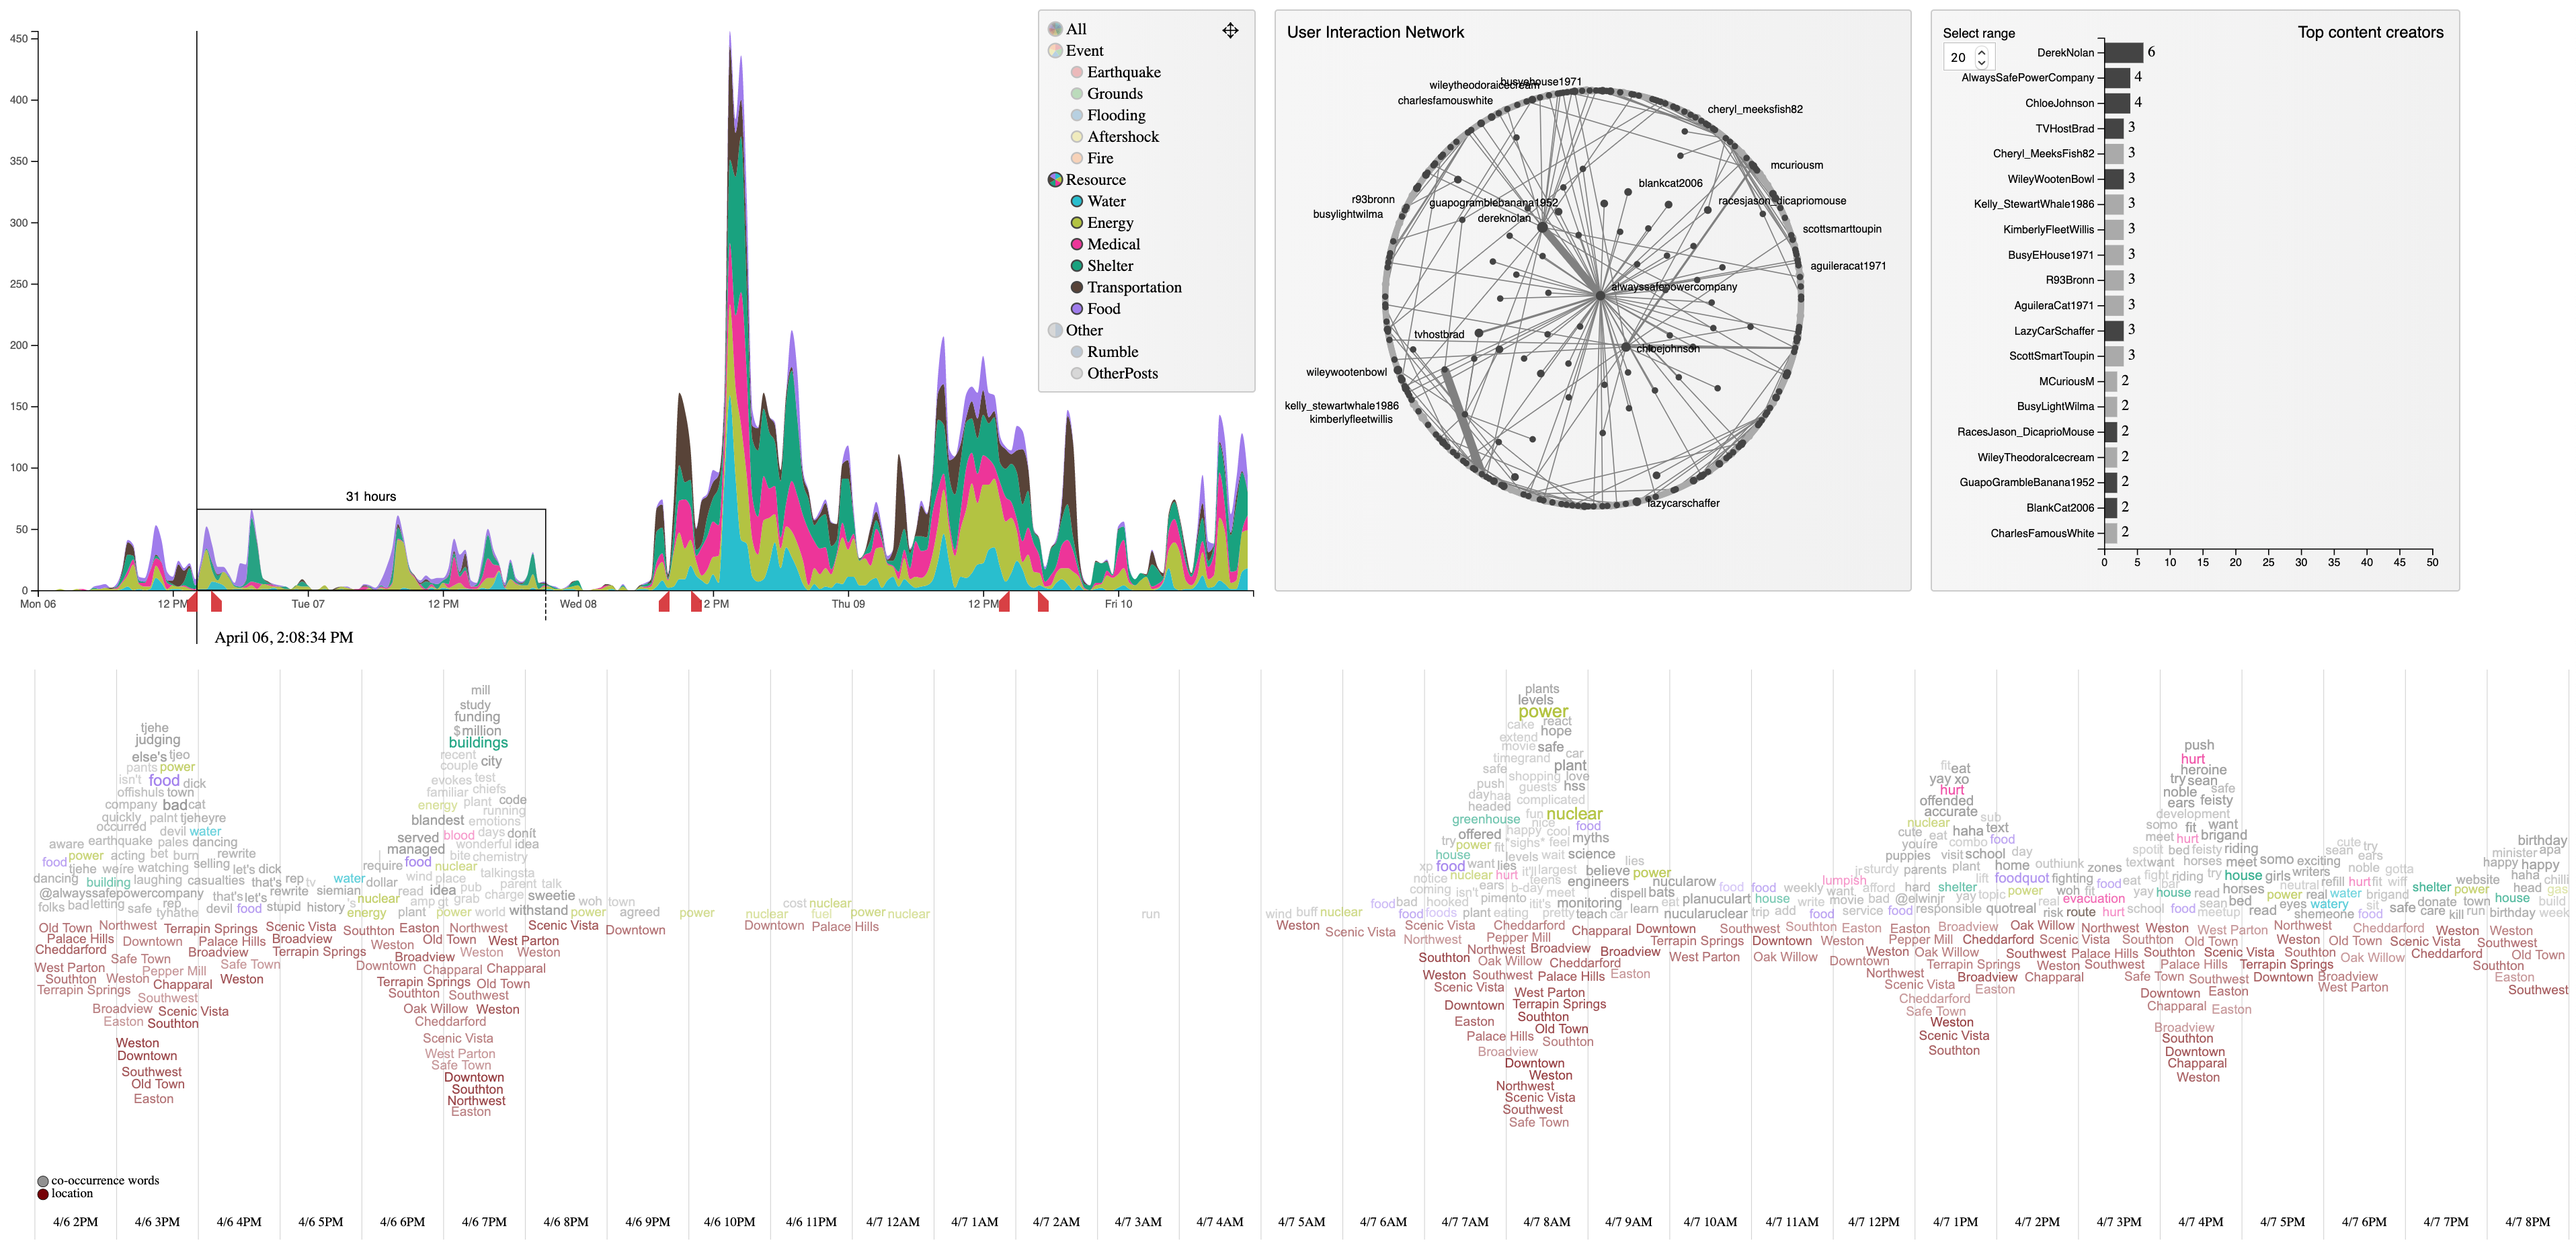
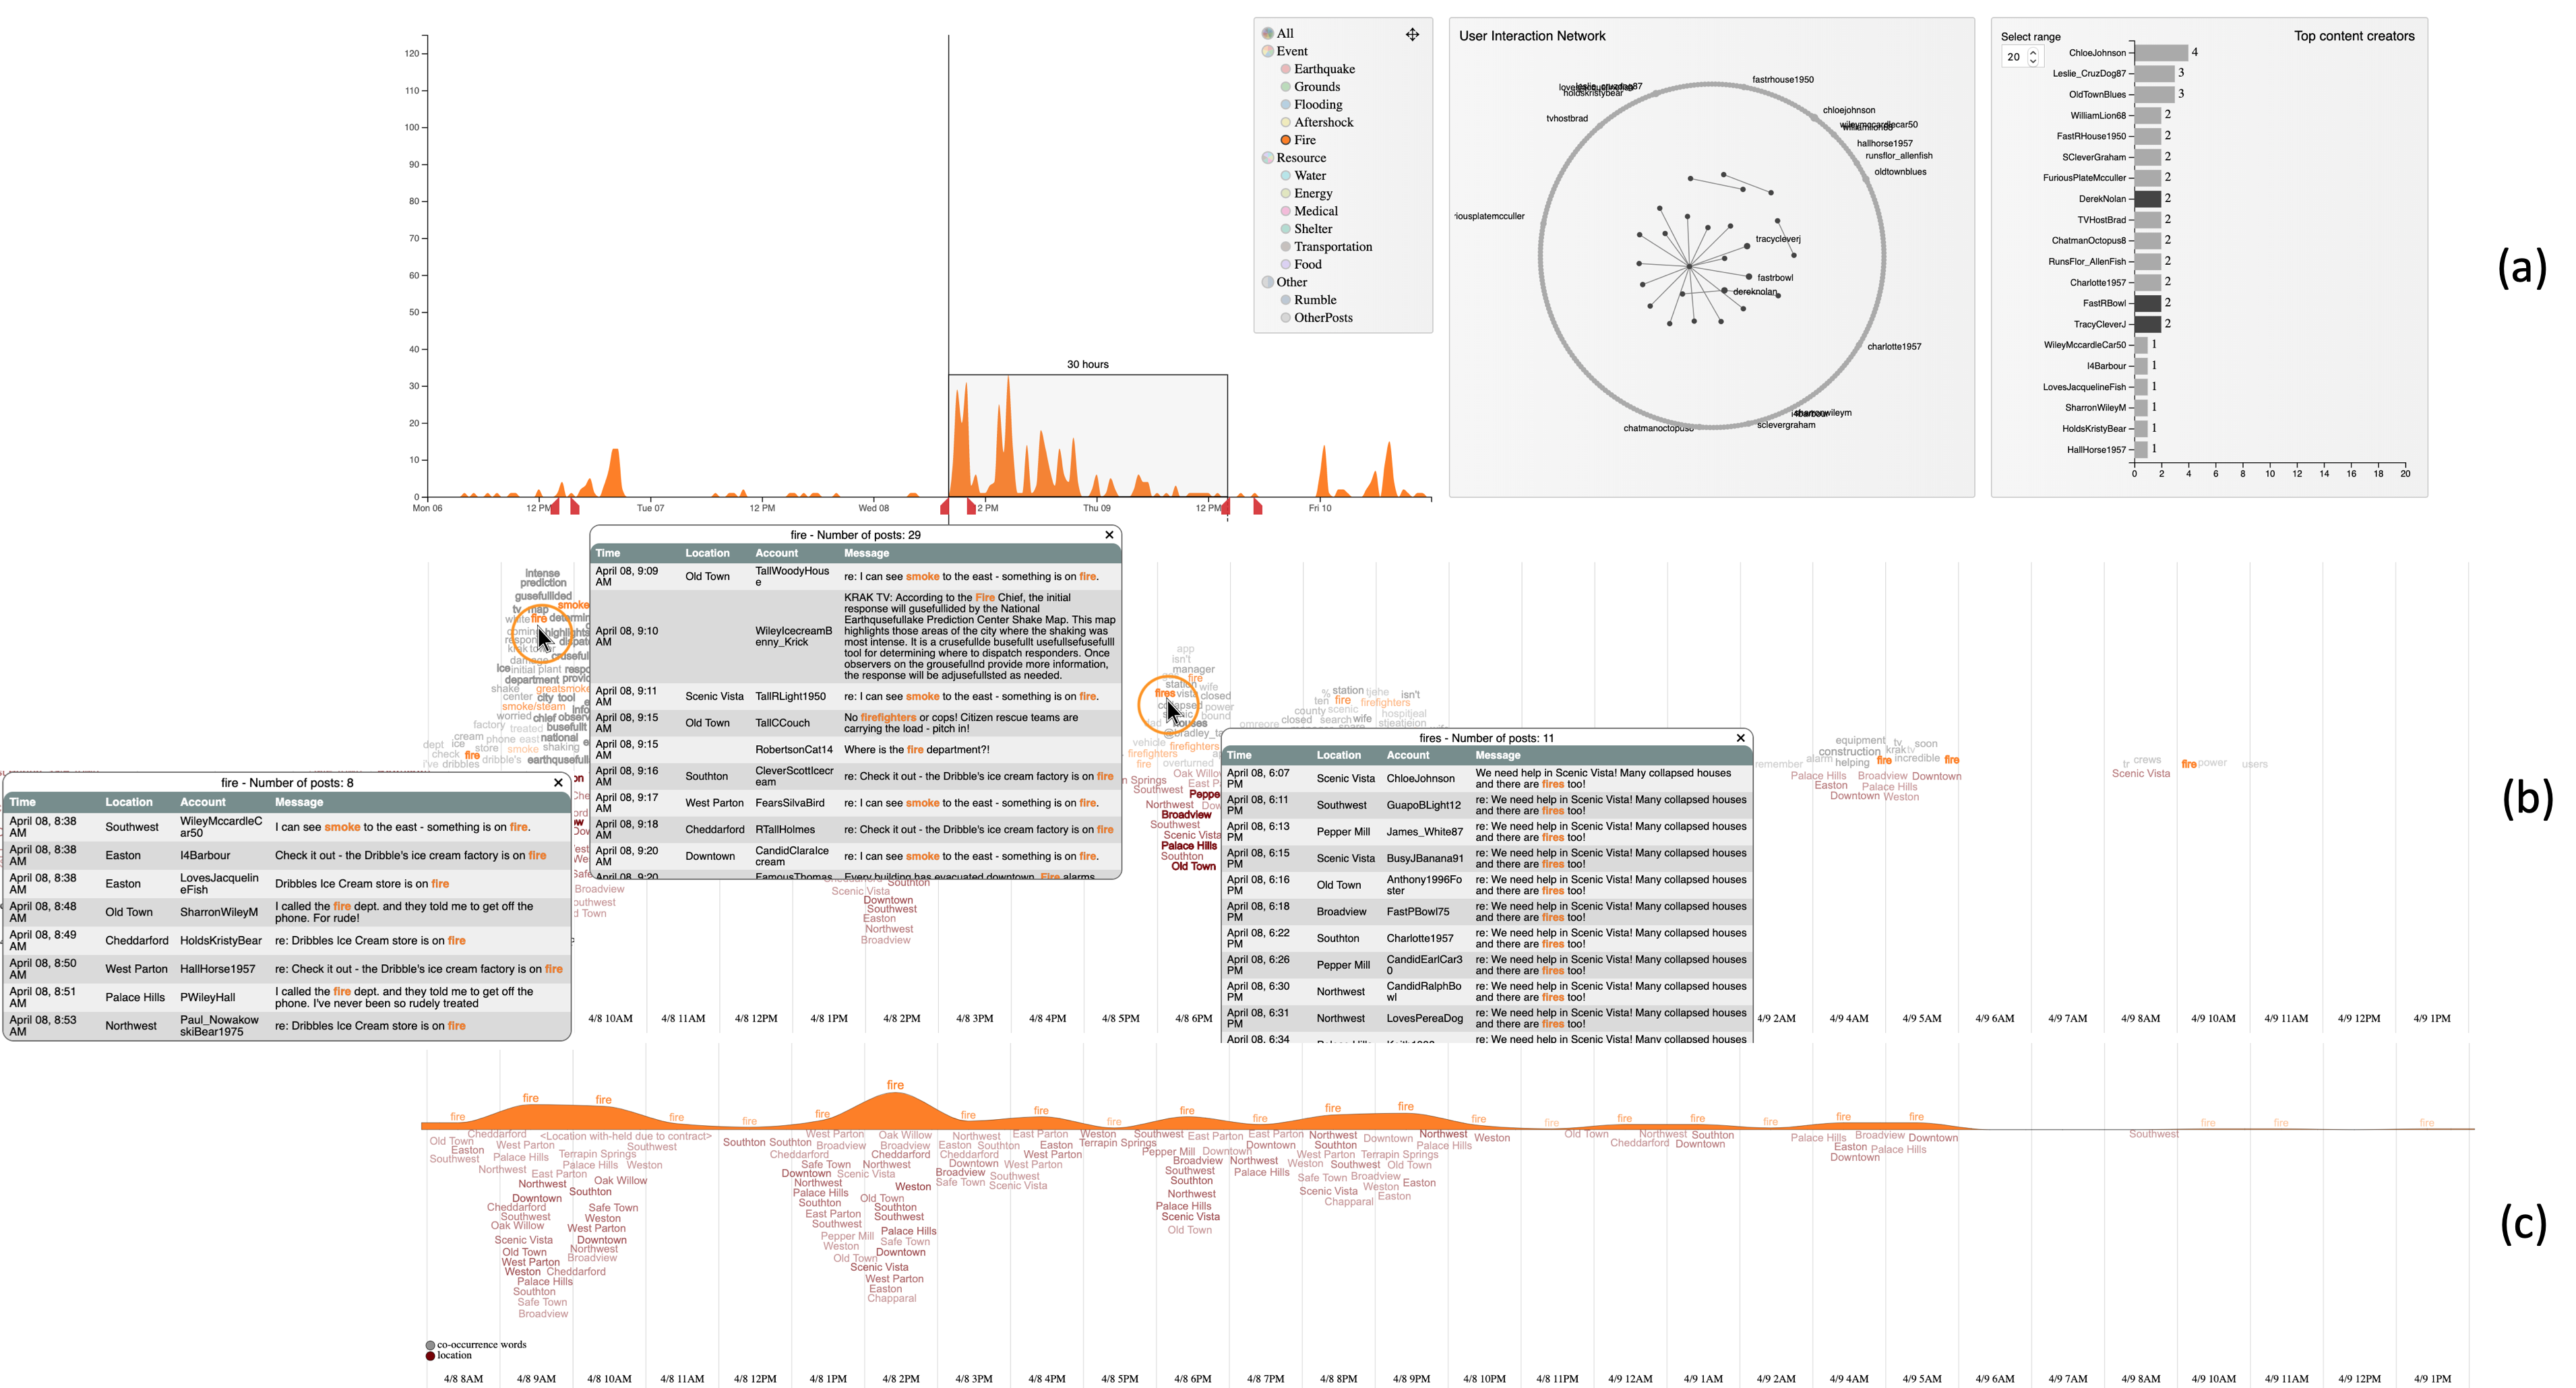
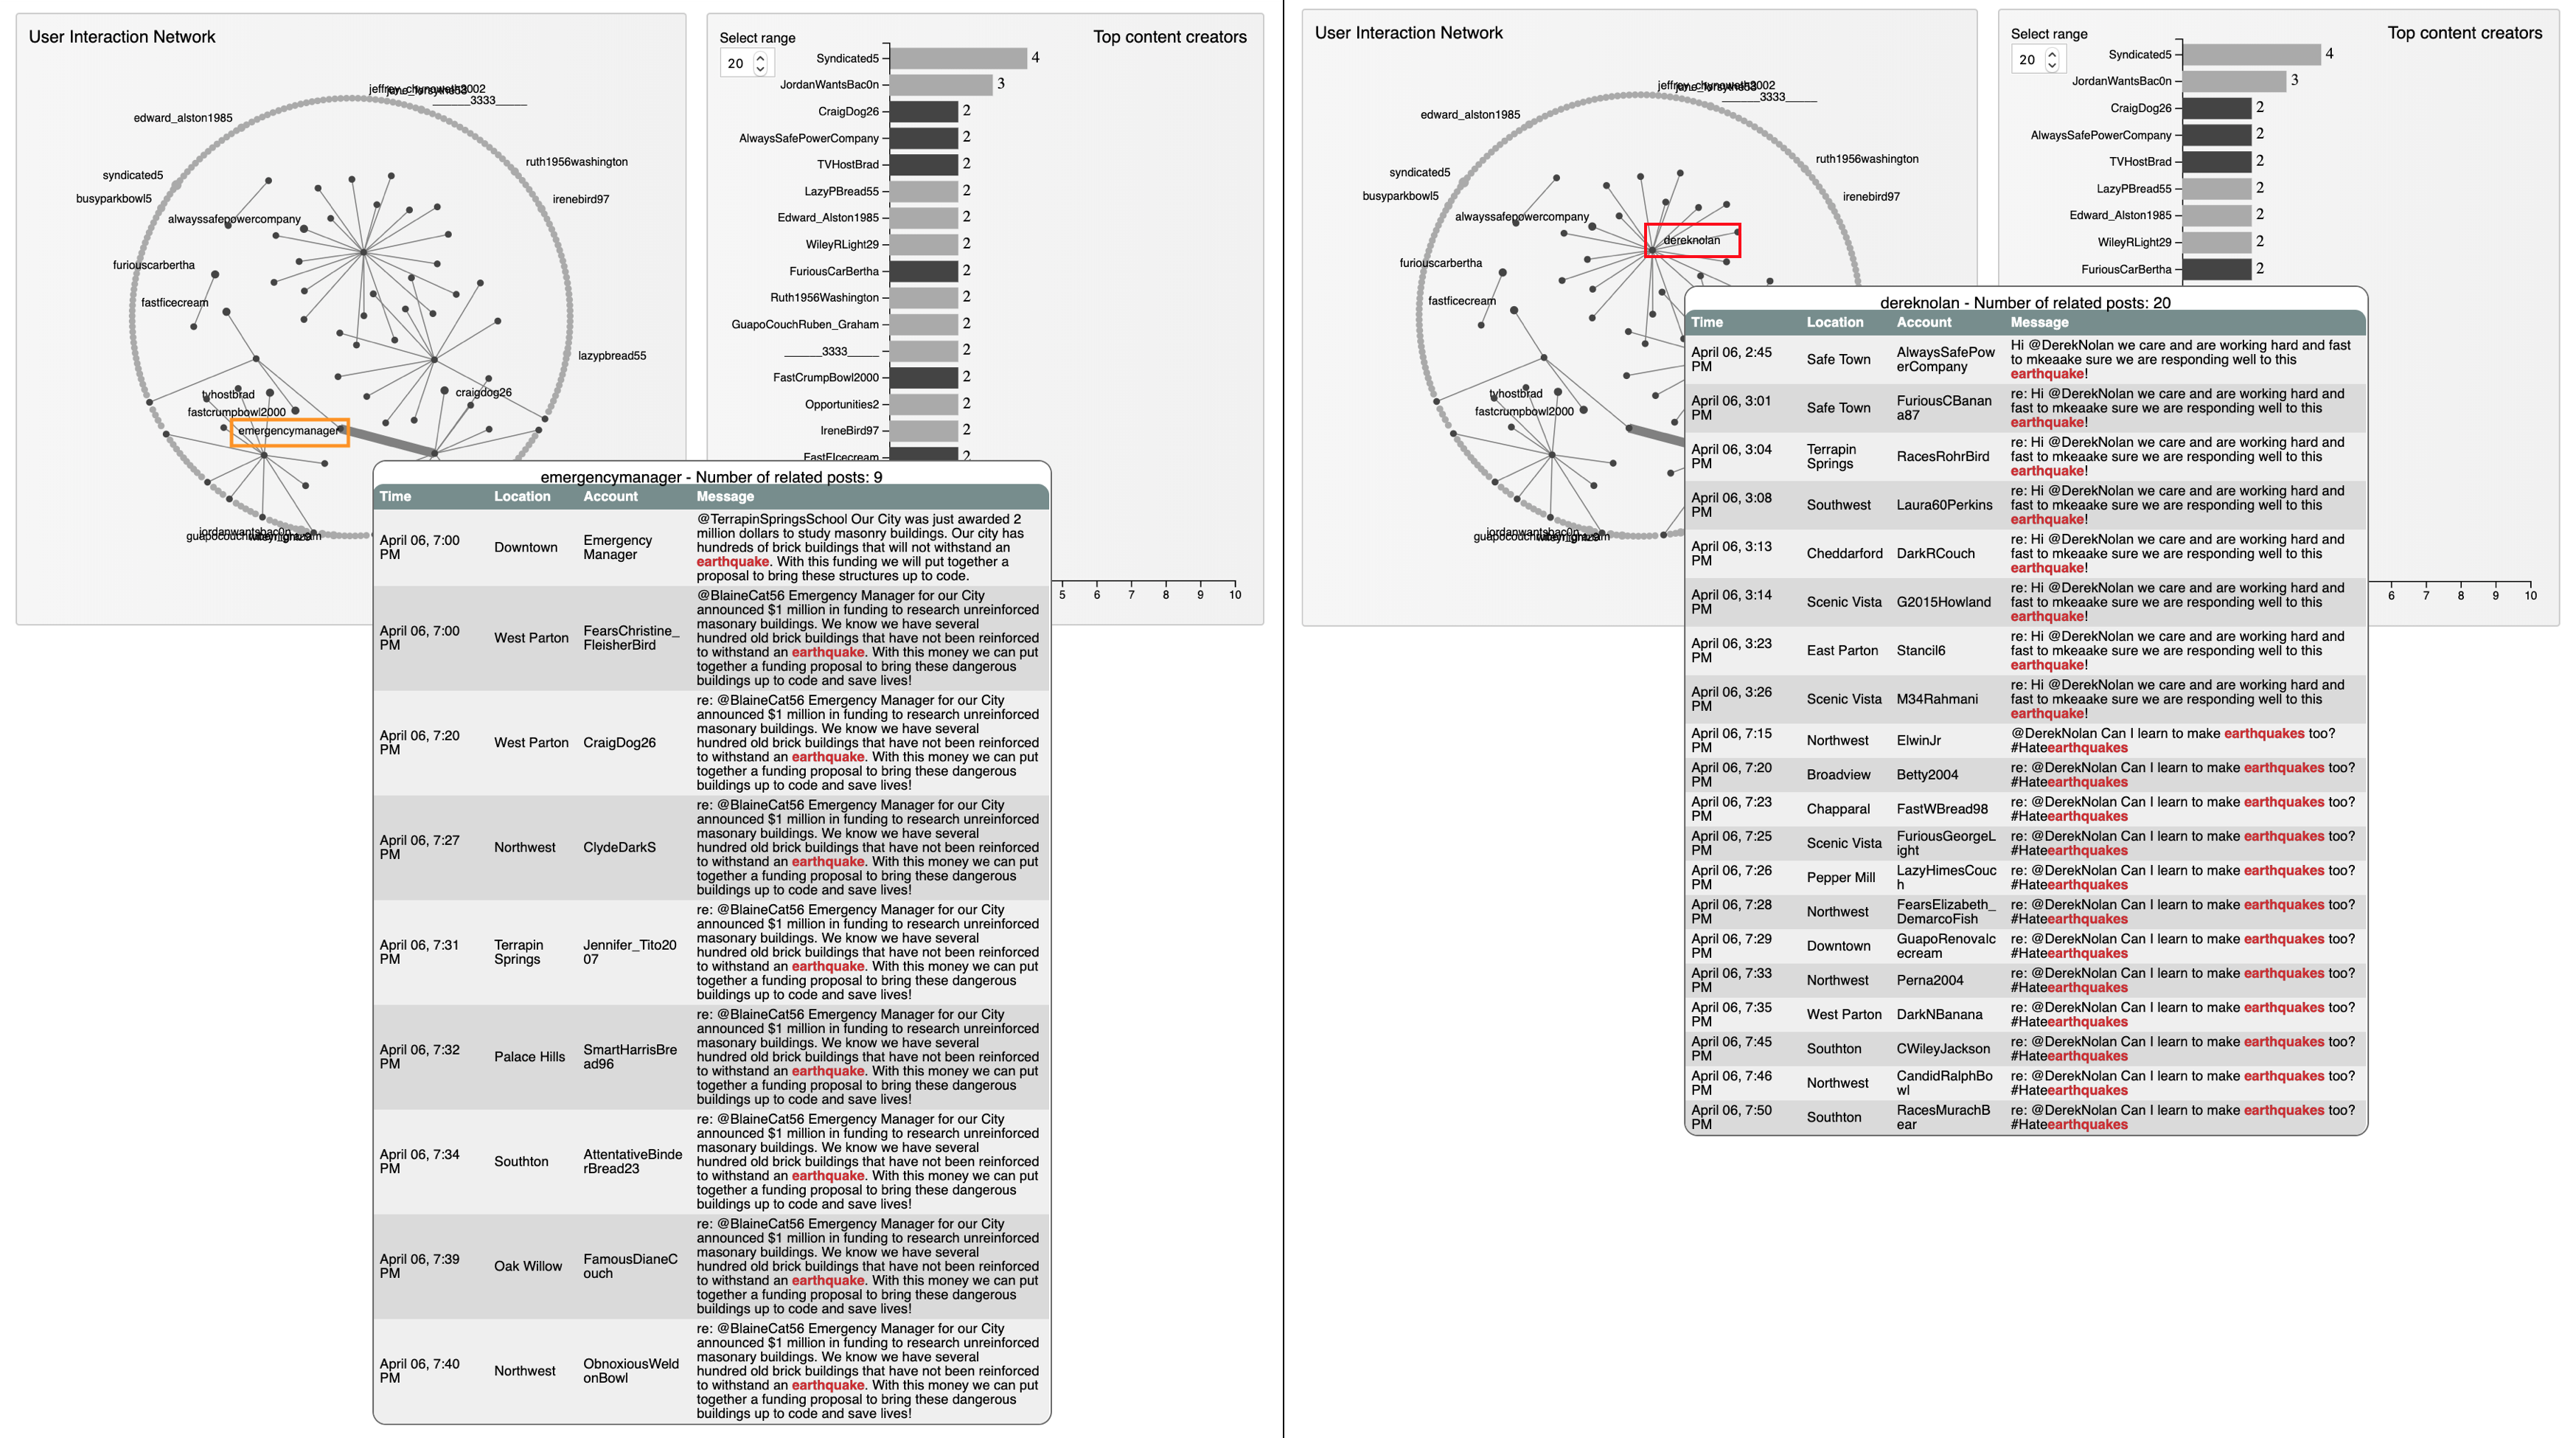
Panel D is a network of user interaction for the chosen time frame and the chosen categories. The network demonstrates the connection between users, through the account mentioning in content of messages. Via this network, we can spot which one is the account that has important role in the community.

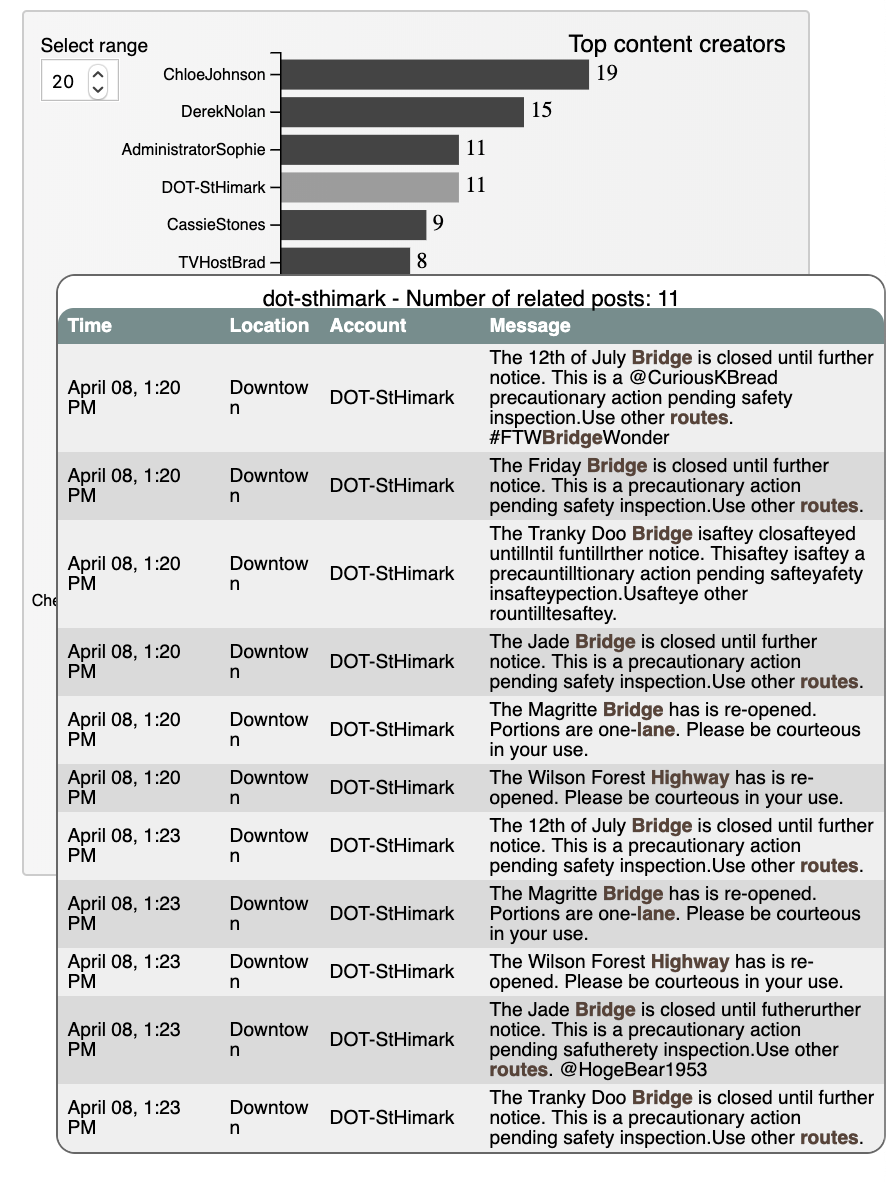
Panel E is an account list for ranking content creators. This chart shows the accounts the write the largest number of posts for the chosen time frame and the chosen categories. From this chart, users can see who write many posts but not connected to the community, exploring these points can help to detect irrelevant accounts.
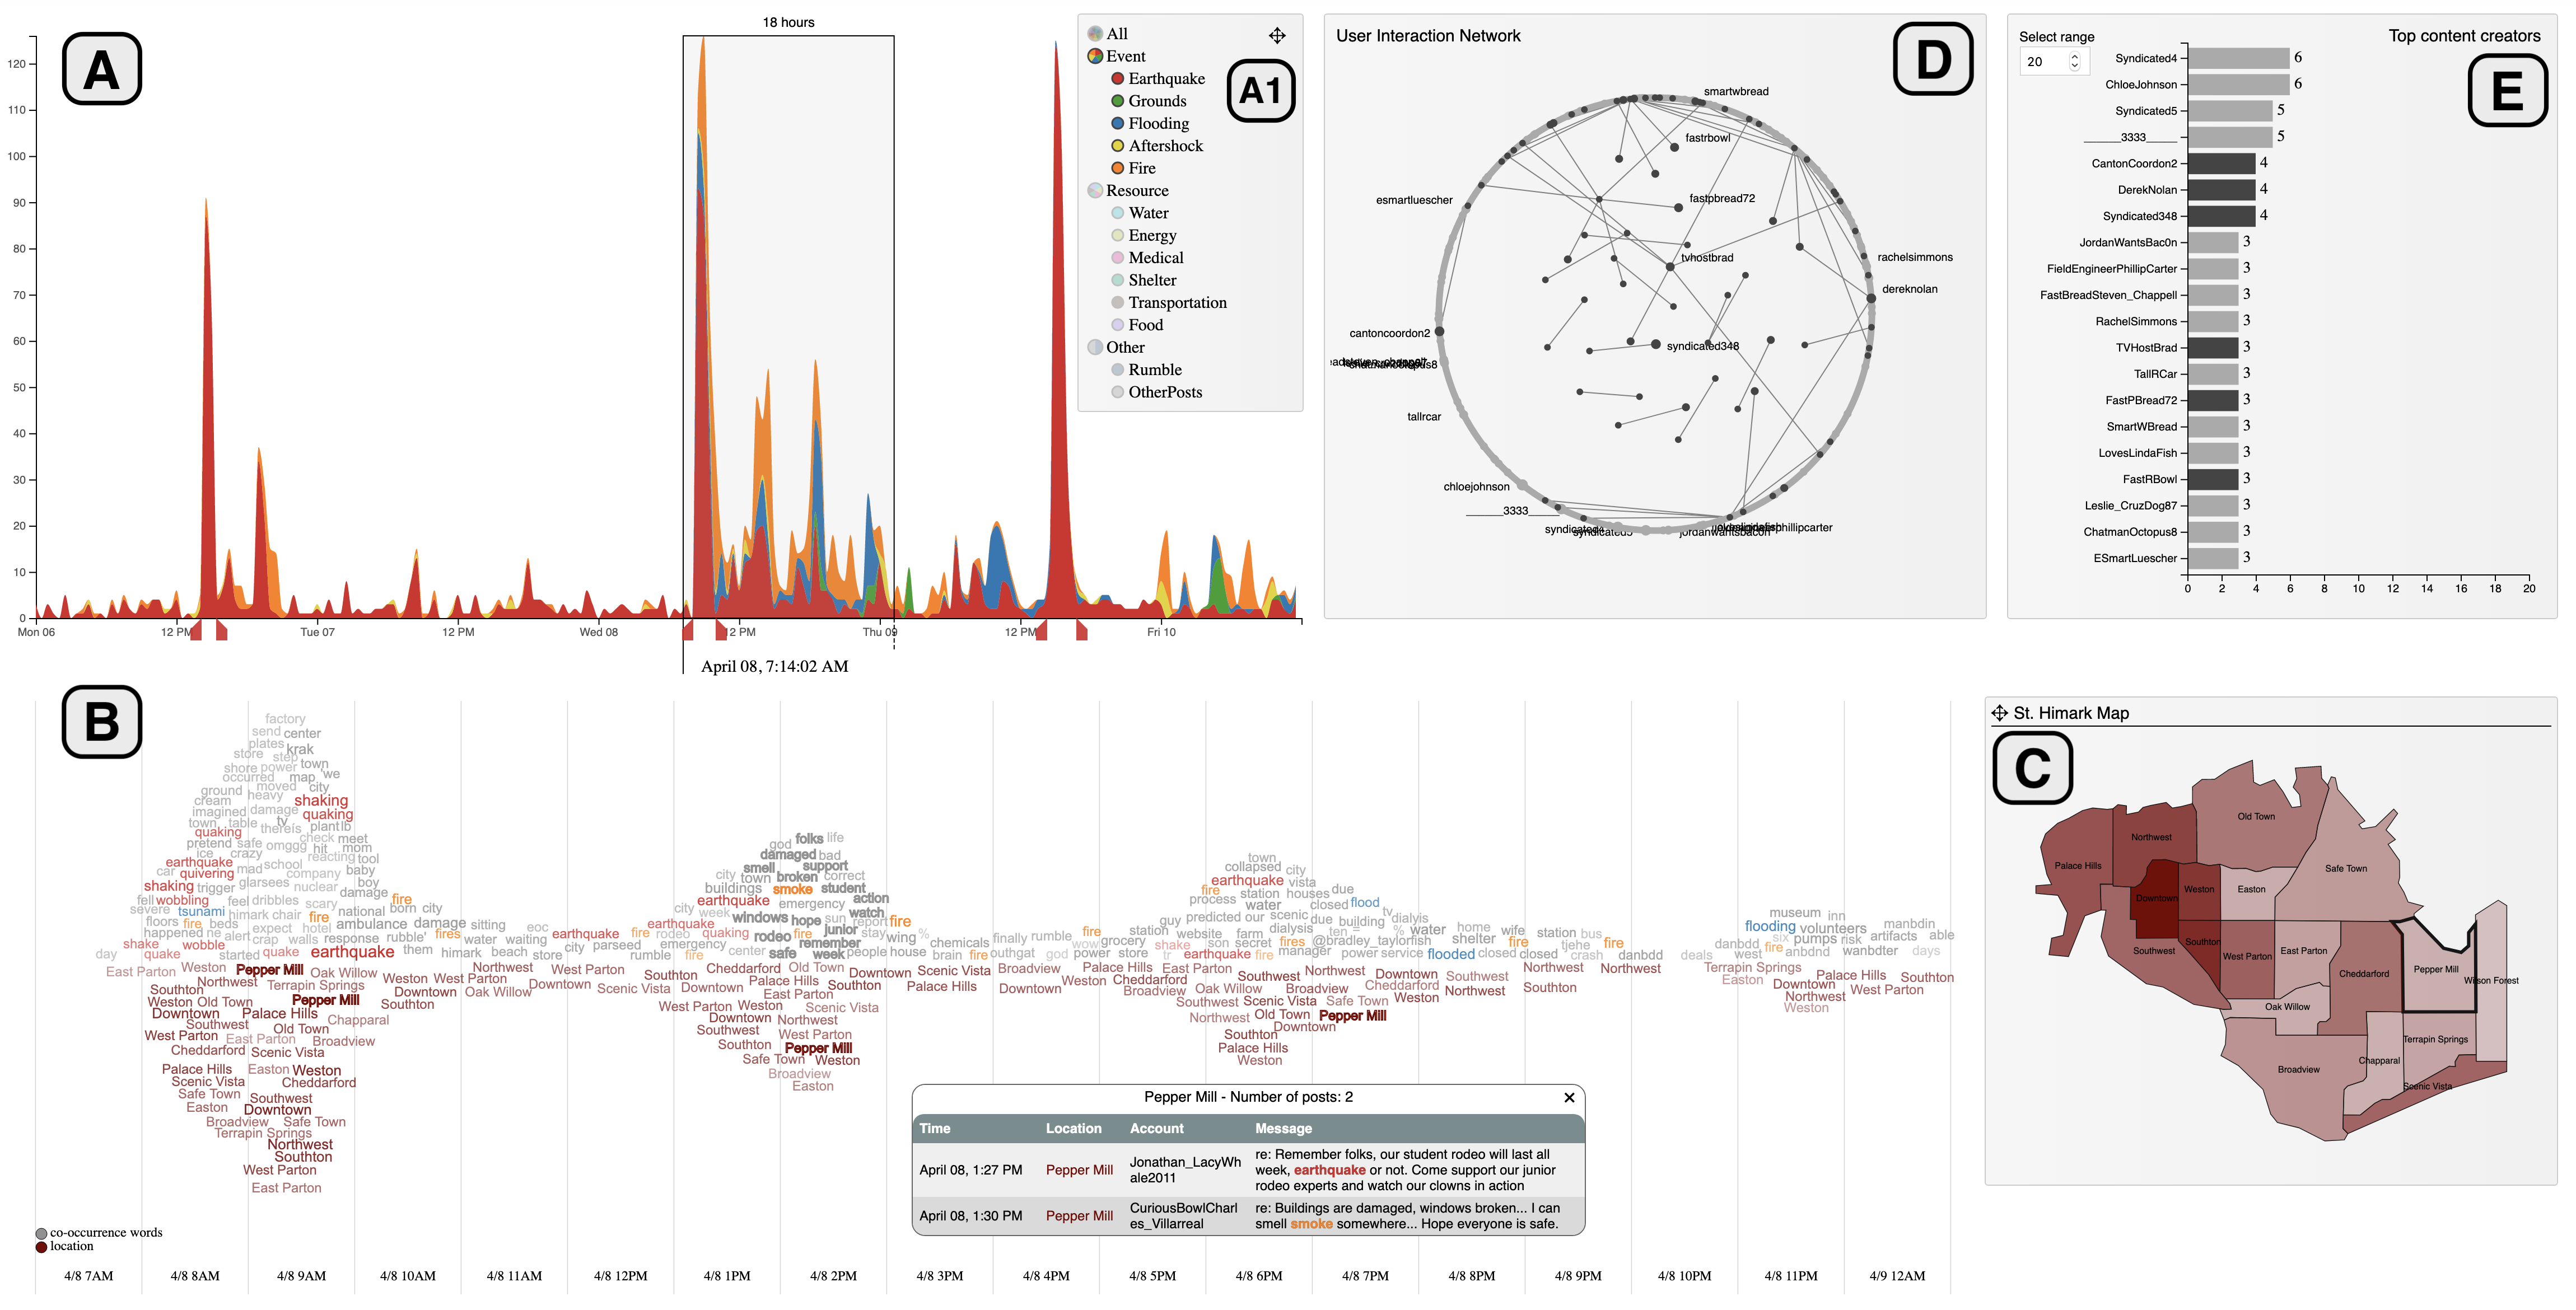
System Overview


To determine the problems that are occurring across the St. Himark, we first built the taxonomy for 1) Types of event related to the earthquake and 2) Types of resources that needed for the situation. The taxonomy:
1. Event, including:
1.1. Earthquake: seismic, earthquake, quake, quaking, shake, shaking, wobble, wobbling, quiver, epicenter
1.2. Grounds (ground damage): mudslide, rupture, landslides, liquefaction
1.3. Flooding: tsunami, flood
1.4. Aftershock: aftershock
1.5. Fire: fire, smoke
2. Resources, including:
2.1. Water: sewage, water, discharge, drain, irrigation, sewer, reservoir
2.2. Energy: blackout, electric, candle, energy, flashlight, fuel, gas, generator, nuclear, power, radiant, radiation, radio rays, valve
2.3. Medical: ambulance, blood, bruise, dehydrate, emergency, escape, evacuate, evacuating, evacuation, fatal, first aid, fracture, hurt, illness, infection, injure, kill, lump, medic, red cross, rescue, rescuing, respiratory, suffering, swollen, urgent, victim, wound
2.4. Shelter: shelter, housing, building, collapse, construction, house
2.5. Transportation: bridge, traffic, congestion, avalanche, highway, lane, logistic, jammed, route, street, transportation
2.6. Food: food

Besides, we have other options of All – total classified messages with all categories and Other, containing Rumble – the app for people to report about the disaster and Other posts – posts that don’t have any of these above-mentioned keywords.

We built the taxonomy with an assumption that one message can belong to more than one category, e.g., a message can indicate that there are needs for both water and food. The reasoning for this assumption comes from the possibility that priorities for resources may change over time, hence we need to take all information into account.

Questions

The City has been using Y*INT to communicate with its citizens, even post-earthquake. However, City officials needs additional information to determine the best way to allocate emergency resources across all neighborhoods of St. Himark. Your task, using your visual analytics on the community Y*INT data, is to determine the types of problems that are occurring across the St. Himark. Then, advise the City on how to prioritize the distribution of resources. Keep in mind that not all sources on Y*INT are reliable, and that priorities may change over time as the state of neighborhoods also changes.

1- Using visual analytics, characterize conditions across the city and recommend how resources should be allocated at 5 hours and 30 hours after the earthquake. Include evidence from the data to support these recommendations. Consider how to allocate resources such as road crews, sewer repair crews, power, and rescue teams. Limit your response to 1000 words and 12 images.

Figure 1-1. Three times the earthquake strikes (upper panel) and details for first strike (lower panel)


From the main control board in Figure 1-1, selection of “Earthquake” show clearly three times that the earthquake strikes. We used the these peak to specify the timestamp earthquake strikes: at around April 06, 2:31:34PM, April 08, 8:34:18AM and April 09, 3:03:20 PM. To consolidate these points, we explore the detail from corresponding messages. The WordStream supports highlighting the keywords in the corresponding categories. When mousing over terms, WordStream highlights the co-occurrences words alongside keywords from the actual messages. Location of these messages are also emphasized in the “Location” stream and in the geolocation map.

On April From 2PM to 3PM, there are 36 messages about earthquake. From Figure 1-1, at 2:33 PM on April 6, at Safe Town, they just recorded an earthquake. This would be the timestamp with the highest accuracy of the first strike.
The first time earthquake strike is around 2:31:30PM, April 06, 2020. The locations that are suffered from this earthquake are Safe Town - with the Always Safe Power Company, Palace Hills, Old Town, Downtown, Pepper Mill, Scenic Vista and Southton.
The second time earthquake strike is around 8:34:18 AM, April 08, 2020. The corresponding locations are Palace Hills, Old Town, Downtown, Scenic Vista and Pepper Mill
The third time earthquake strike is around 3:03:20 PM, April 09, 2020. This time, the earthquake has vast impact on a broad area, including Old Town and Weston (two severe location), Palace Hills, Northwest, Southwest, Downtown, Scenic Vista, Broadview, Terrapin Springs, Cheddaford, Souton, East Parton and West Parton.
Resource allocation

Figure 1-2. 5 hours after first strike

Figure 1-3. 30 hours after first strike

To characterize the needed resource at 5 hours and 30 hours after the earthquake, the window width size should be 6 and 31, respectively, to fully explore the condition.
The first strike
Right after the first strike, the main concerns were food (with messages about food complain), power (related to AlwaysSafePower Company). In this strike, the effect is not very severe, because medical or emergency stream is very minimal. However, after 5 hours, main concern of people is “Shelter” (buildings). The second strike
5 hours after second strike:
This time, due to broken sewer pipes, water can be contaminated. These place need sewer crews: Old Town, Safe Town, Scenic Vista, Broadview, Chapparal, Easton.

Figure 1-4. 5 hours after second strike

At this time, some bridges are closed, according to the DoT of St.Himark, Figure 2-4, therefore the road crew need to be at each particular address of each bridge to fix the bridge.
30 hours after second strike:

Figure 1-5. 30 hours after second strike

The emergency resources stretched to the reconstruction and repair of reservoirs, dams, rural water supply, latrines.

The third strike:
5 hours after:

Figure 1-6. 5 hours after third strike

In this situation, the bridges to get in and out of St.Himark are closed and opened for safety inspection, according to the DoT - Department of transportation. Therefore the road crew need to be at these places.
30 hours after:

Figure 1-7. 30 hours after third strike

The scope of data provide for maximum of 21 hours after the third strike. At this point, there are needs for shelter with messages such as "trying to find the disaster shelter".
2 - Identify at least 3 times when conditions change in a way that warrants a re-allocation of city resources. What were the conditions before and after the inflection point? What locations were affected? Which resources are involved? Limit your response to 1000 words and 10 images.

Figure 2-1. Resources overview

The first time
Re allocation resources is related to changes in demand over time. From the overview of resources in Figure 2-1, at 12:46:39PM April 08, there are two consecutive peaks of resources. The stream of "Water" is high in the first peak, but went down in the second peak. Down to the Wordstream, "water" is emphasized. To get a deeper view, we look into Figure 2-2. The water was conteminated, and also water pipes were broken.

Figure 2-2. Water resource

Also in this time, "Transportation" is in high demand due to closed bridges, as in Figure 2-3.

Figure 2-3. Transportation notification from DOT


After this time, the demand for "Water" and "Transportation" reduced, also there are needs for evacuation and shelter, hence the changes in priority.
The second time

Figure 2-4. The second time for resource priority change

At 7:24:42 AM April 09, first, there are high demand for almost all resource categories, however, after 1-2 hours after that, the situation was mitigated, shown in decline for resouce needs.
The third time

Figure 2-5. The third time for resource priority change

At 1:08:43 PM April 09, first, there are high demand for electricity and very few for water, however, after 1-2 hours after that, highest change in demand is food and transportation.
3 - Take the pulse of the community. How has the earthquake affected life in St. Himark? What is the community experiencing outside the realm of the first two questions? Show decision makers summary information and relevant/characteristic examples. Limit your response to 800 words and 8 images.

Related events to the earthquake that may occur during and after earthquake are included to characterize the condition as a whole. Besides earthquake, the city also suffered from related event, including: Flood, Ground damage, Aftershock. Especially, a fire happen at a broad area.

Figure 3. Earthquake and related events that happened

Flooding
In this section, the flood event is examined. In panel (b) in , the keywords related to "Flood", such as "flooded", "flooding" are taken into account. From this approach, we specify that the neighborhood that have been flooded includes: Old Town, East Parton, West Parton, Cheddarford, Northwest, Scenic Vista, Terrapin Springs.

Figure 4. (a) Event of flooding; (b) Detail of events that happened in the city and their coressponding locations; (c) Trending of flooding event concern over time


Fire
There is fire in a broad area. According to Figure 5, the fire started at about 8:38AM April 8, and keep spreading to the area of Scenic Vista, Northwest and Oak Willow (severe), also: Old Town, Downtown (the fire in Downtown spread for a long time), Broadview, Easton, Weston and Southton.

Figure 5. (a) Event of fire; (b) Detail of events that happened in the city and their coressponding locations; (c) Trending of fire event concern over time


From the community
Beside taking the messages from the keywords, we verify the events through the accounts with important roles in the community. We define these account by their interaction and influence to other account. By sliding the window along the time line, we can spot who has multi connection to the community overtime. From these accounts, we can determine what is the community is experiencing, since these accounts tend to raise their voice for communnity.

Figure 6. Emergency Manager (left) and dereknolan (right), two accounts that have influence in the community.

4 - The data for this challenge can be analyzed either as a static collection or as a dynamic stream of data, as it would occur in a real emergency. Describe how you analyzed the data - as a static collection or a stream. How do you think this choice affected your analysis? Limit your response to 200 words and 3 images.

For this application, we analyze data as a static. All the computation, visualization and analytics are done dynamically. The system updates every time there are any changes in the main control board - panel A in System Overview Figure, the changes can come from expanding the window size, sliding window, or changing the categories. This choice affect the analysis in: We decide to go with this choice with purpose of making interactive analysis for earthquake situations. In future work, we will focus on processing streaming data.

All 5 panels updated in:
Figure 7 and 8 : Changes in timestamp.
Figure 8 and 9 : Changes in categories applied.

Figure 7. The overall analysis of category Event at 6:55:15 PM, April 6

Figure 8. The overall analysis of category Event at 4:35:59 PM, April 8

Figure 9. The overall analysis of category Resource at 4:35:59 PM, April 8