Big Data Visualization, visual analytics, and Virtual Reality
Tommy Dang
Assistant Professor
Department of Computer Science
Texas Tech University
Huyen Nguyen, PhD student
Outline
Chemical Simulations
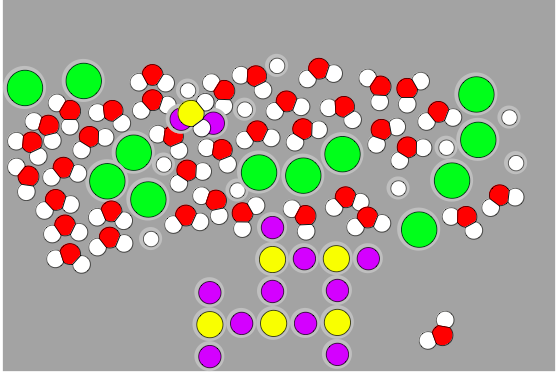
Link to the Connected Chemistry application
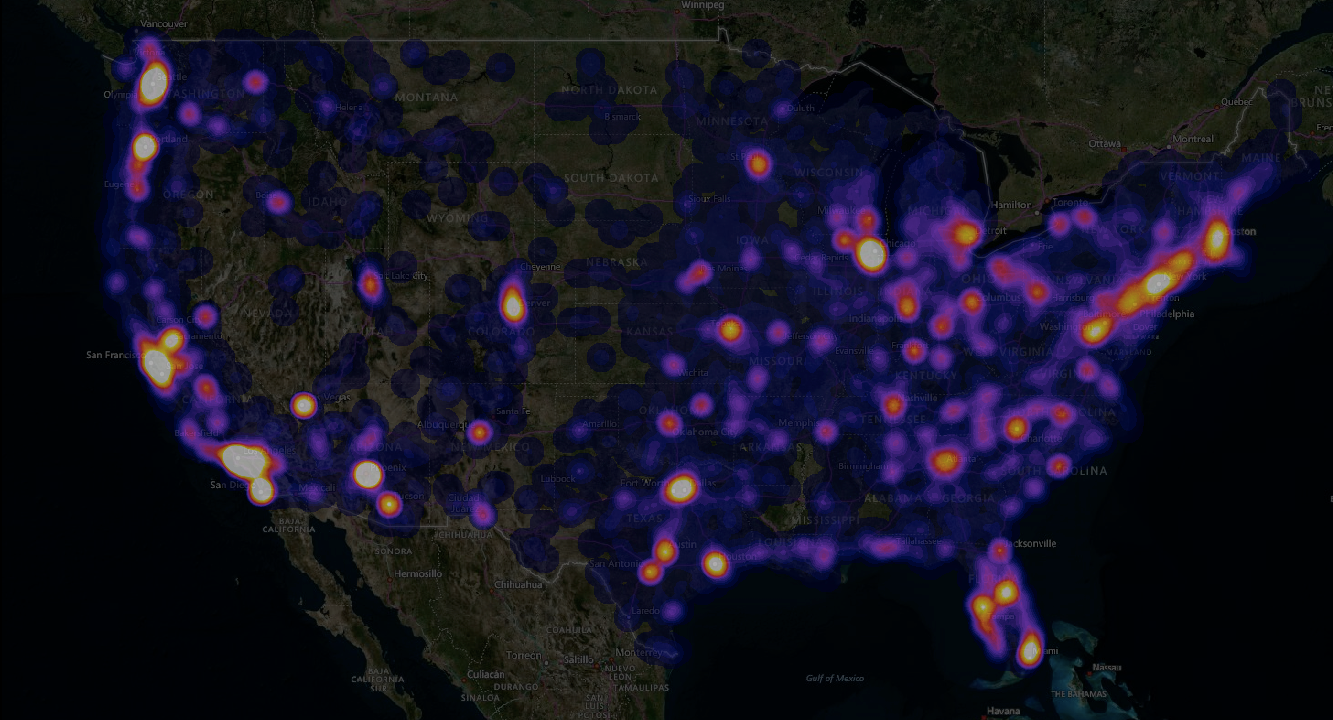
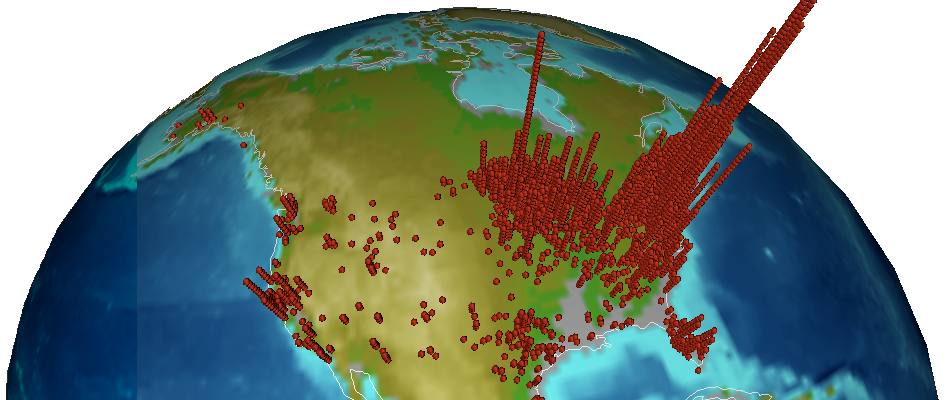
Geospatial visualizations
Outline
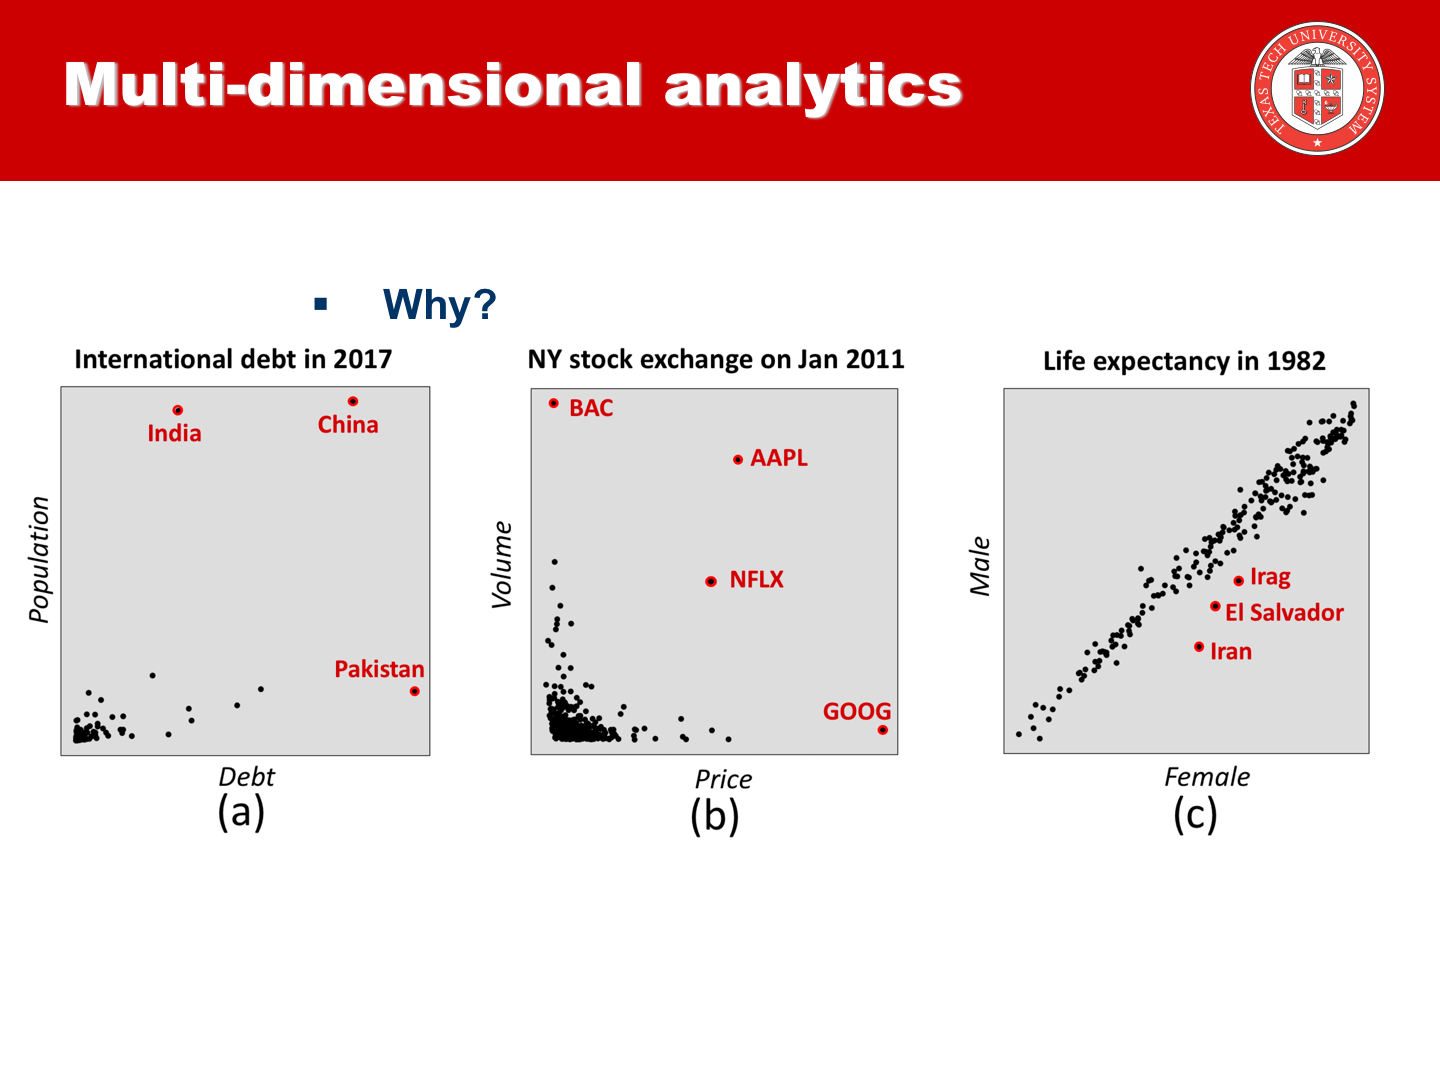
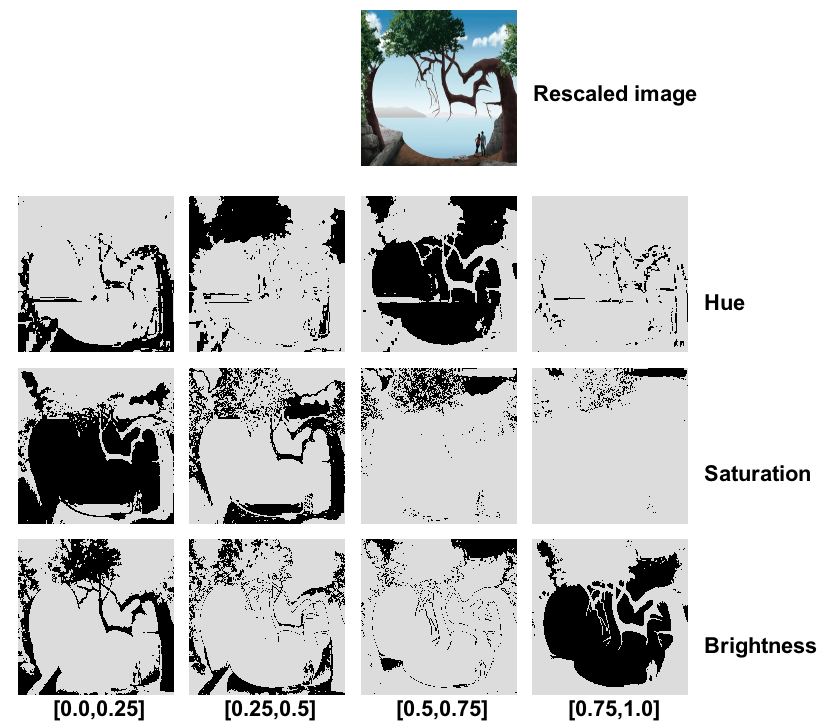
Scatterplot
Visual features
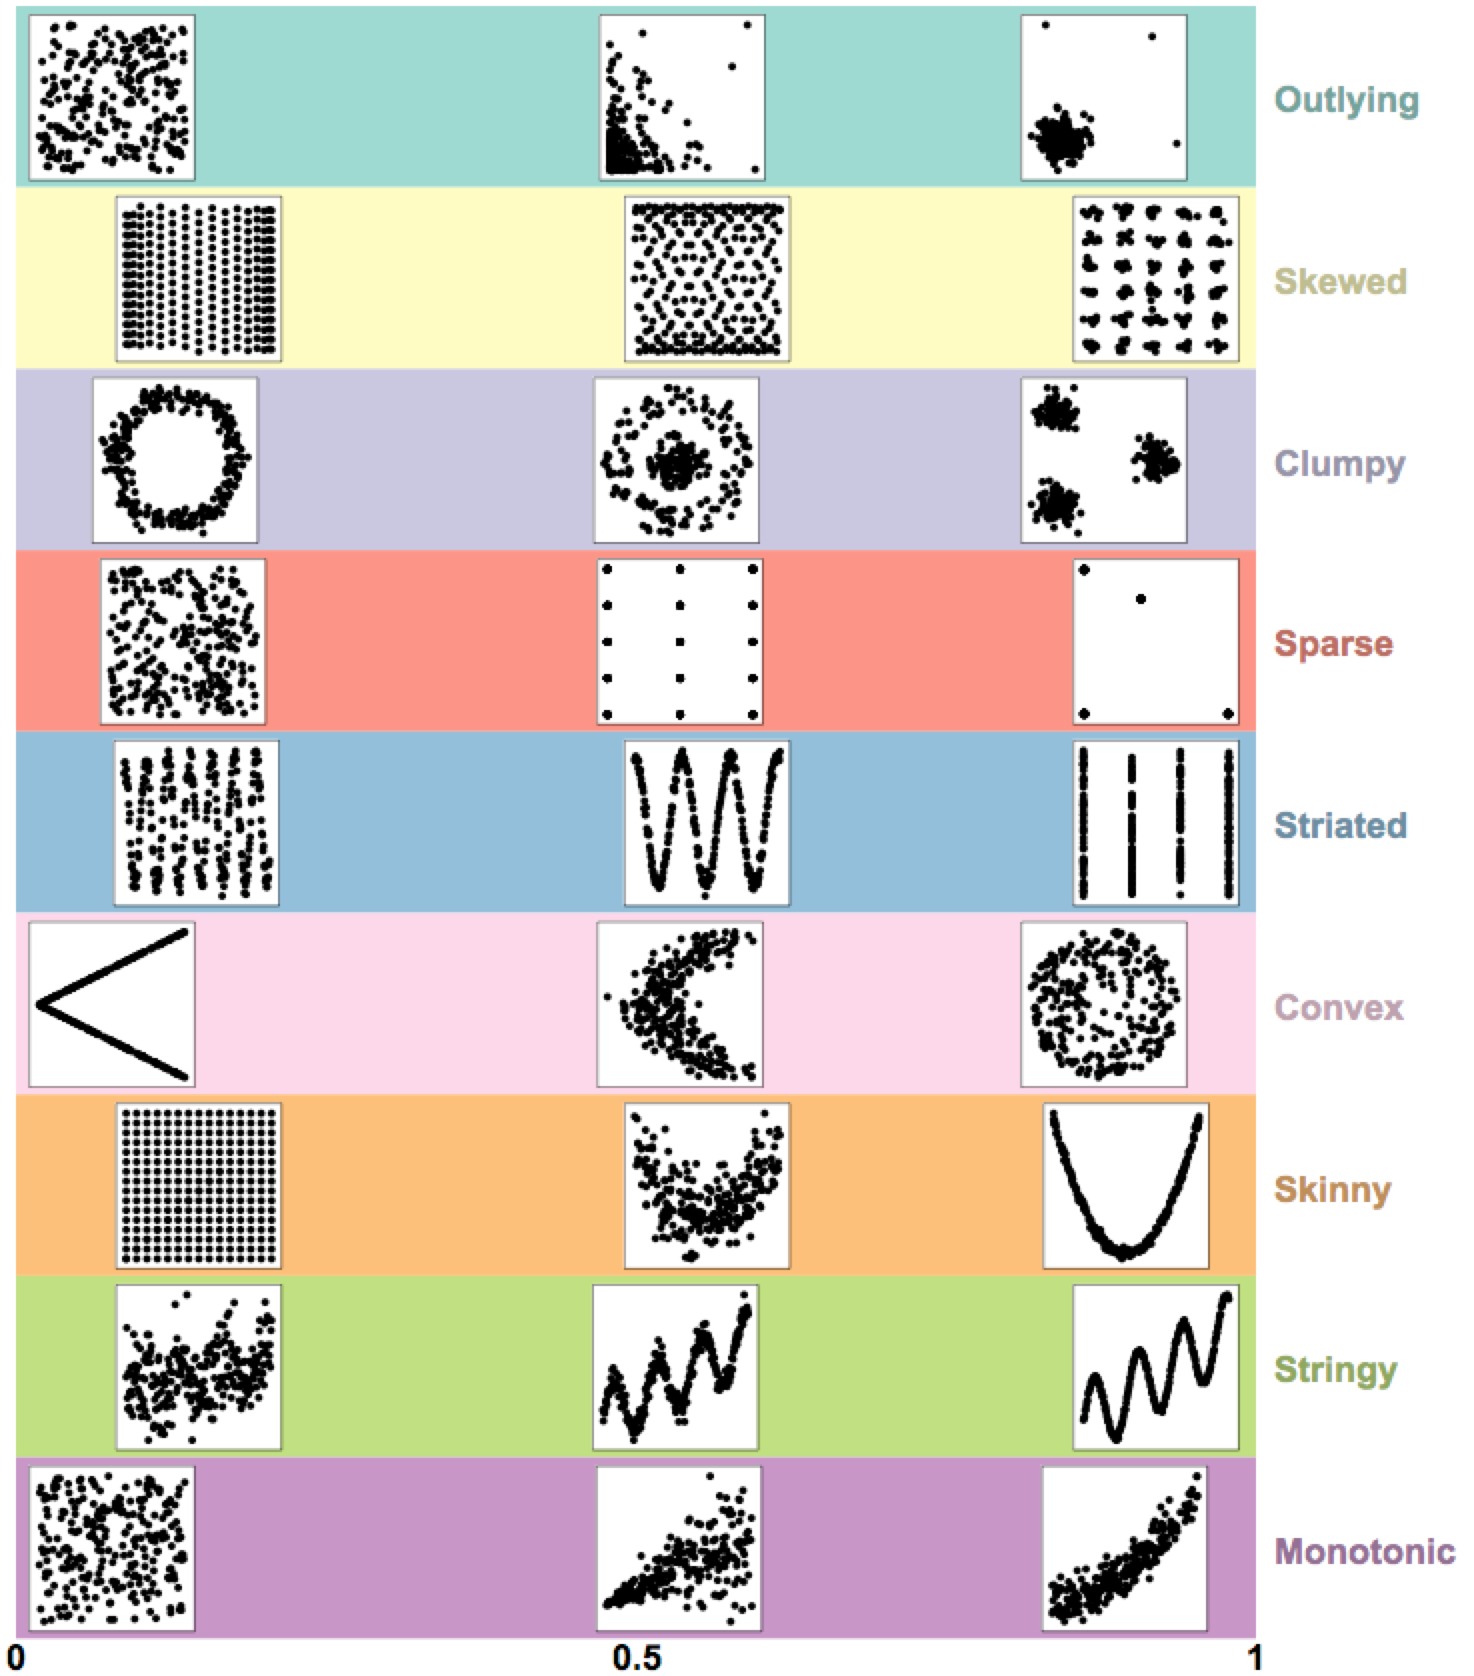
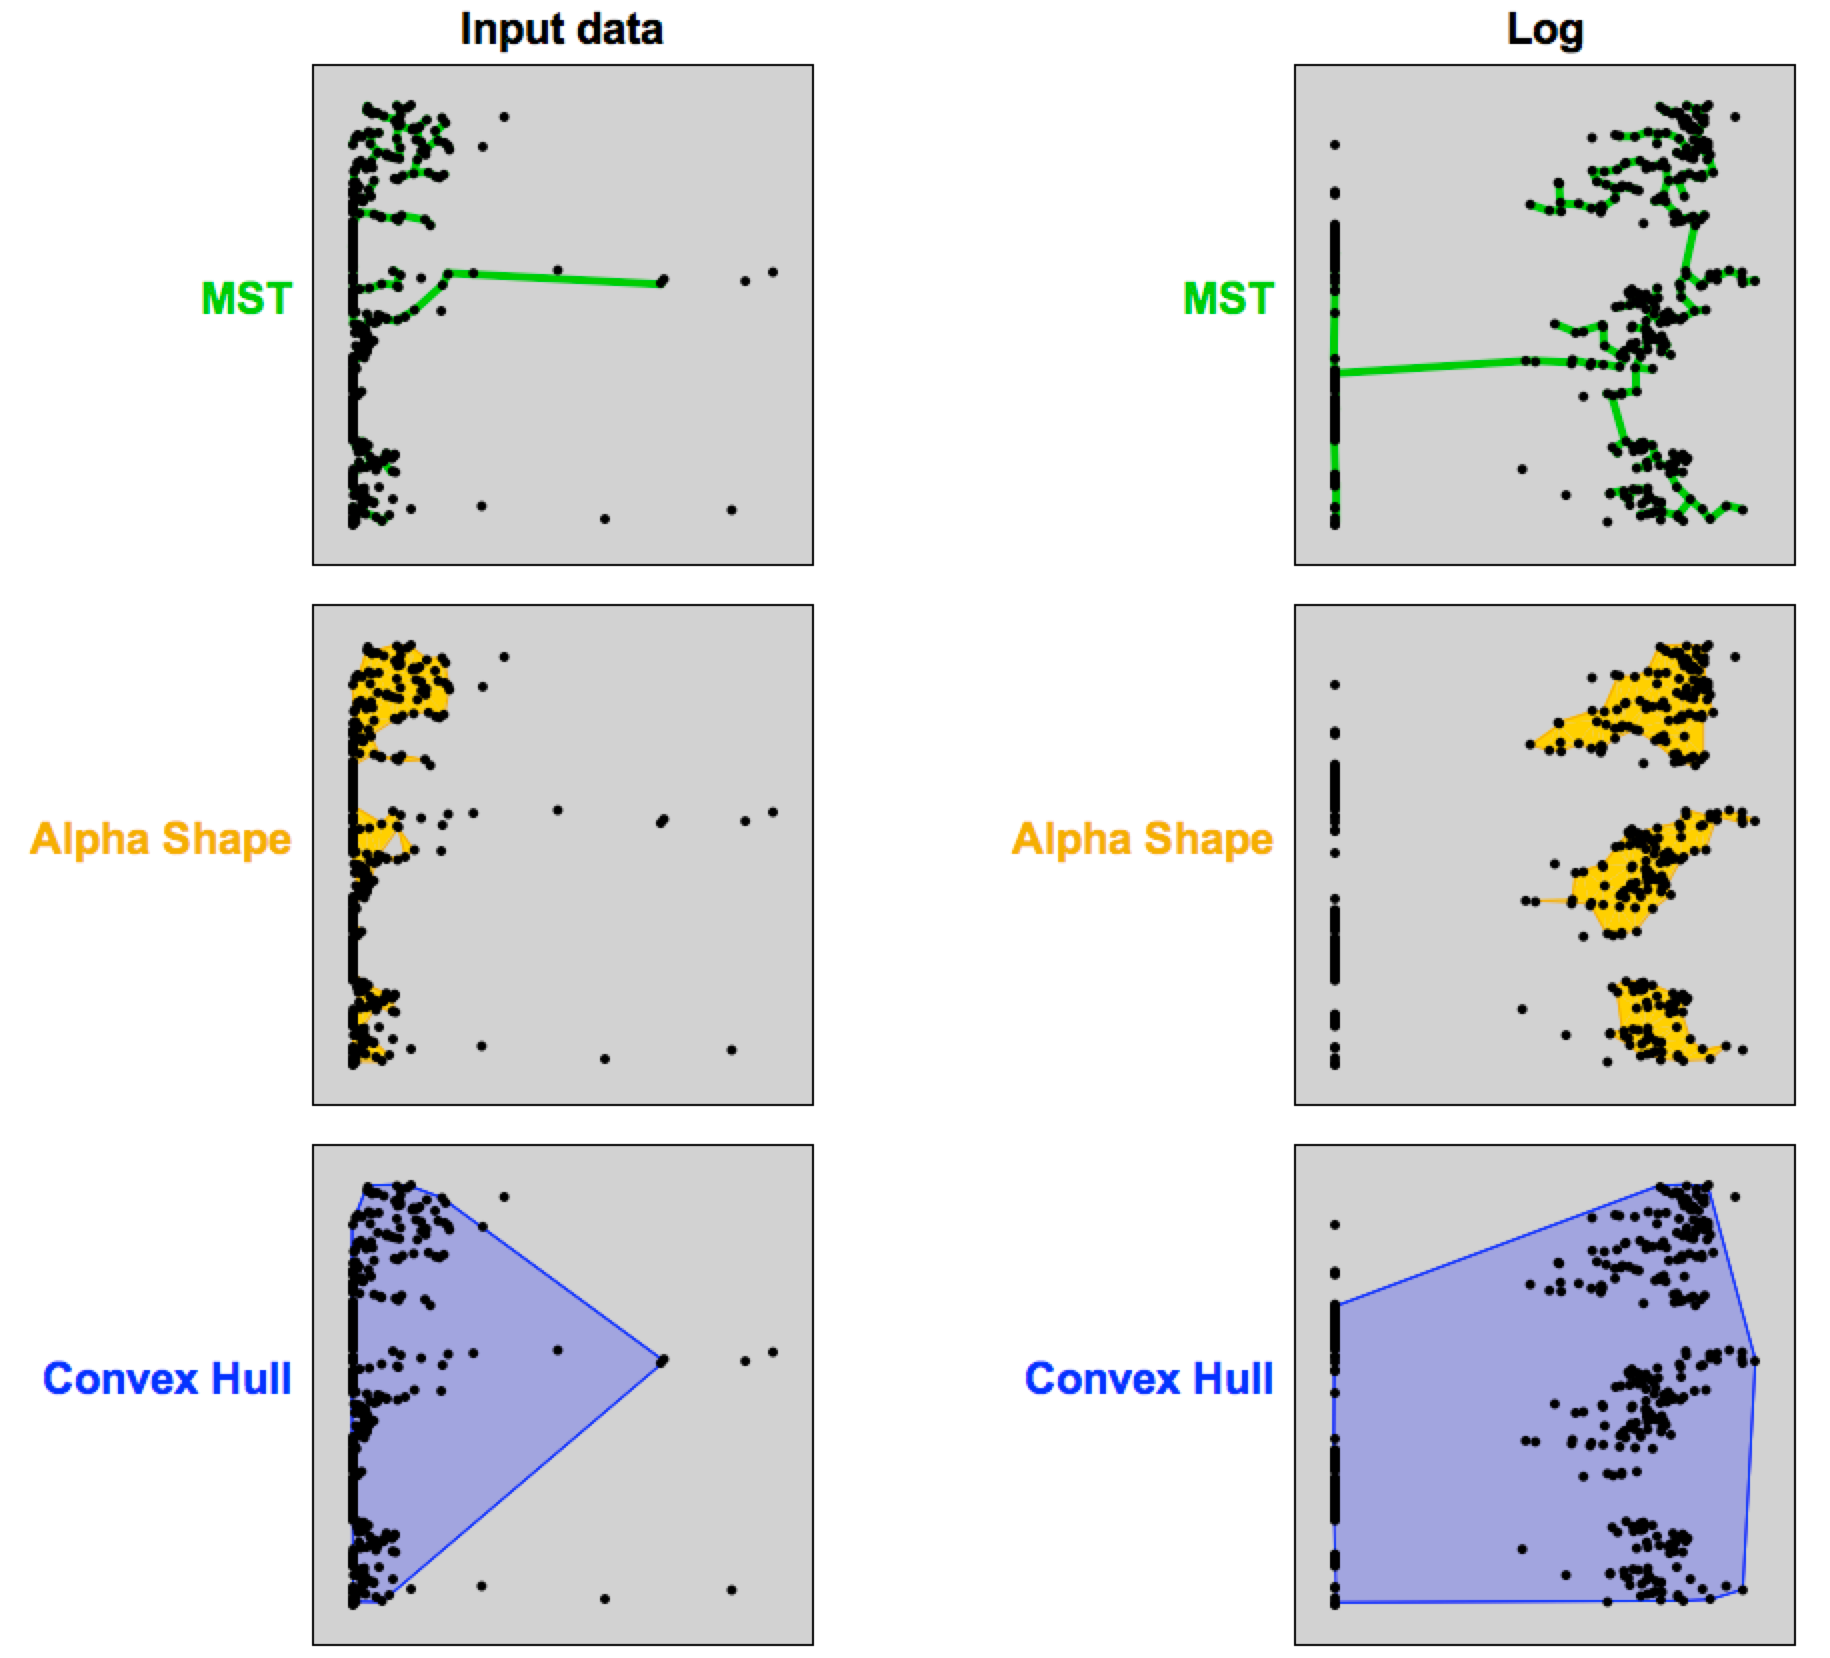
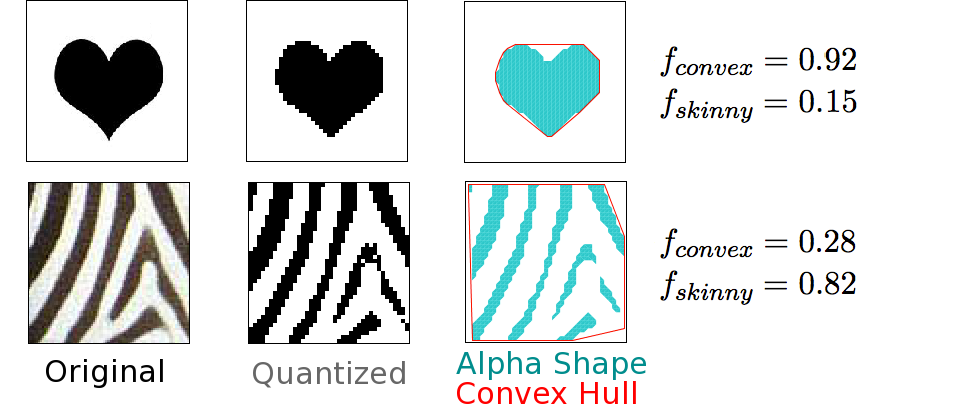
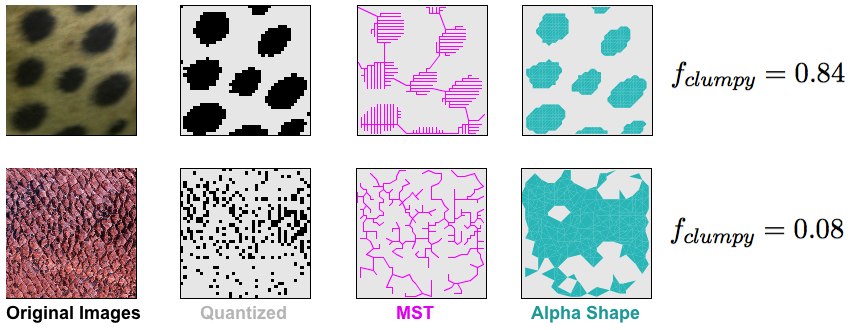
Scagnostics are computed on on three geometric graphs
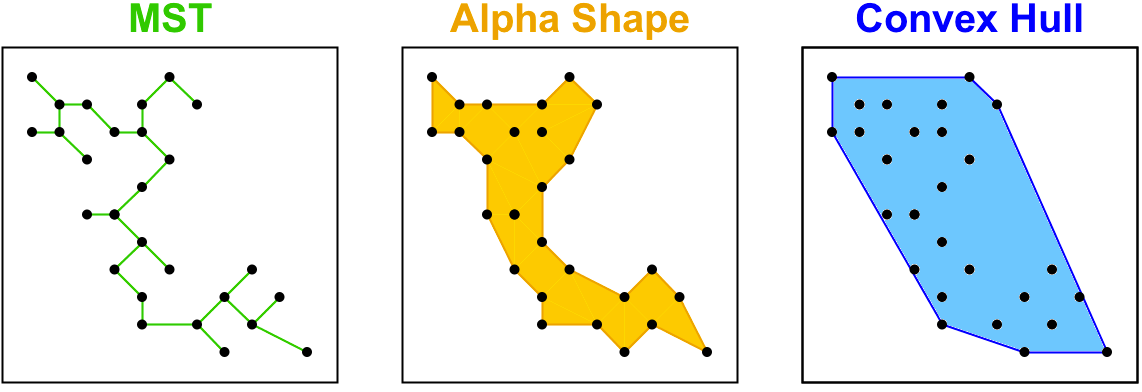
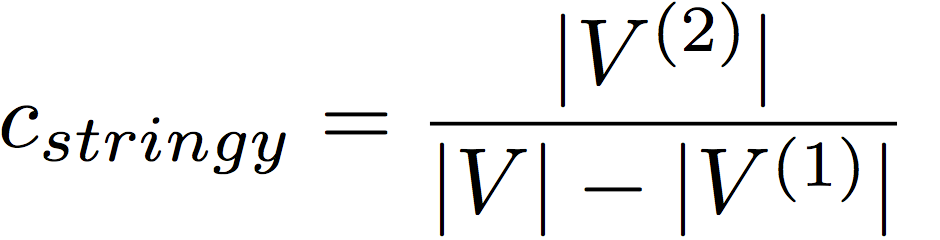
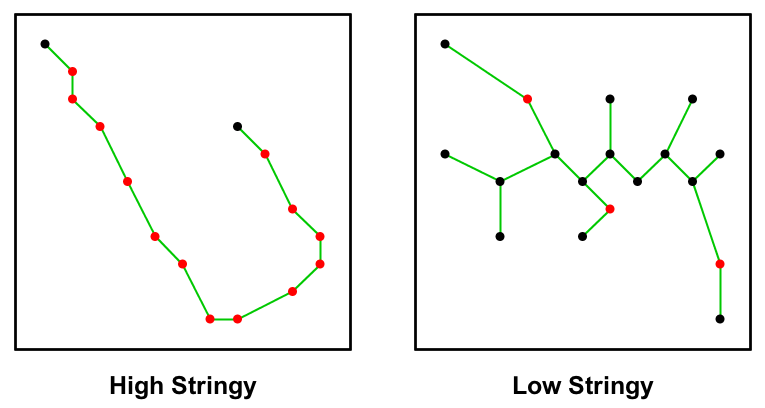
A Stringy shape is a skinny shape with no branches
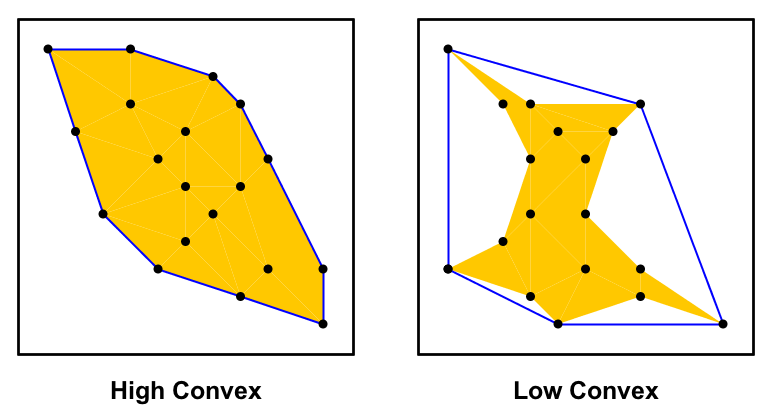
Computing Convex: The ratio of the area of the alpha hull and the convex hull
Example: Stringy Scagnostics
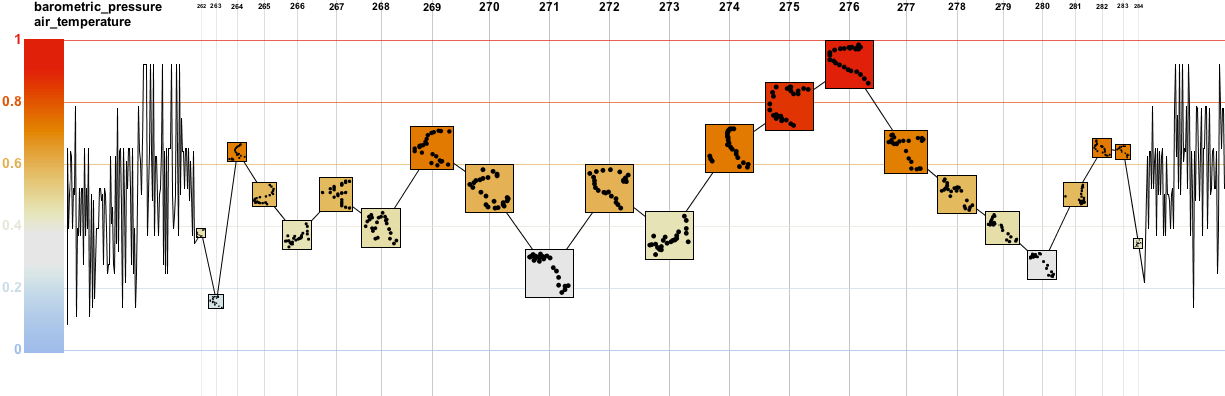
TimeSeer demo
The US Employment data comprise monthly employment rates of various economy factors for 50 states over 22 years from 1990 to 2011.
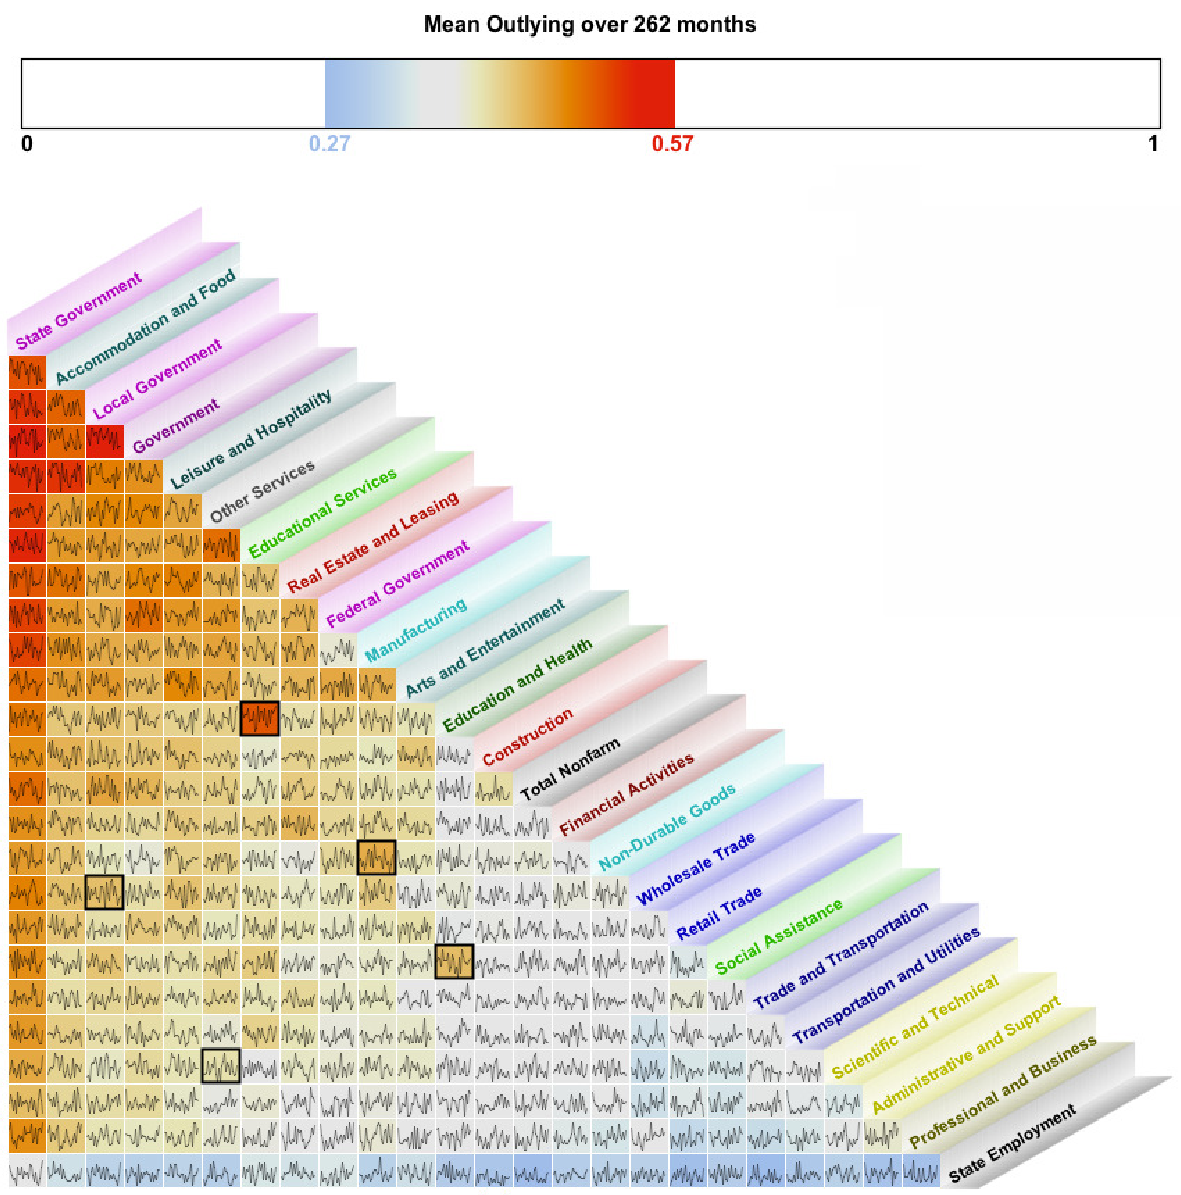
 The data are retrieved from Bureau of Labor Statistics
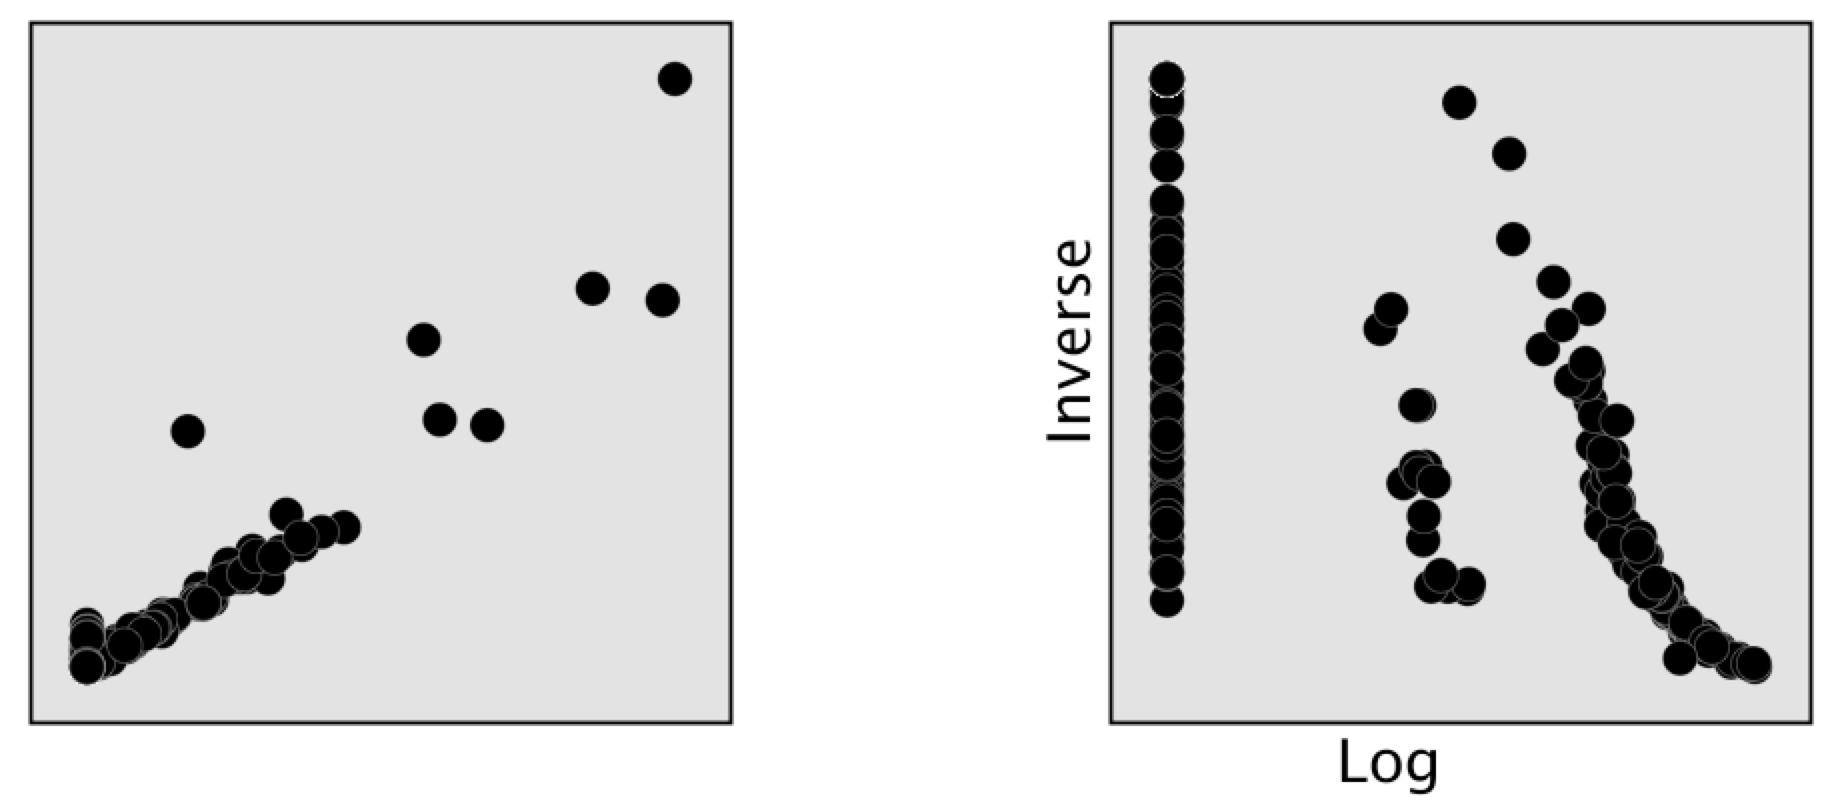
Transforming Scagnostics
 Annual NYC subway ridership from 1904-2006: http://davis.wpi.edu/xmdv/datasets/subway.html
Transforming Scagnostics
Tuan Dang and Leland Wilkinson. Transforming Scagnostics to Reveal Hidden Features. IEEE Transactions on Visualization and Computer Graphics 20(12), presented at VAST 2014
 Musk dataset from UCI: https://archive.ics.uci.edu/ml/datasets/Musk+(Version+2)
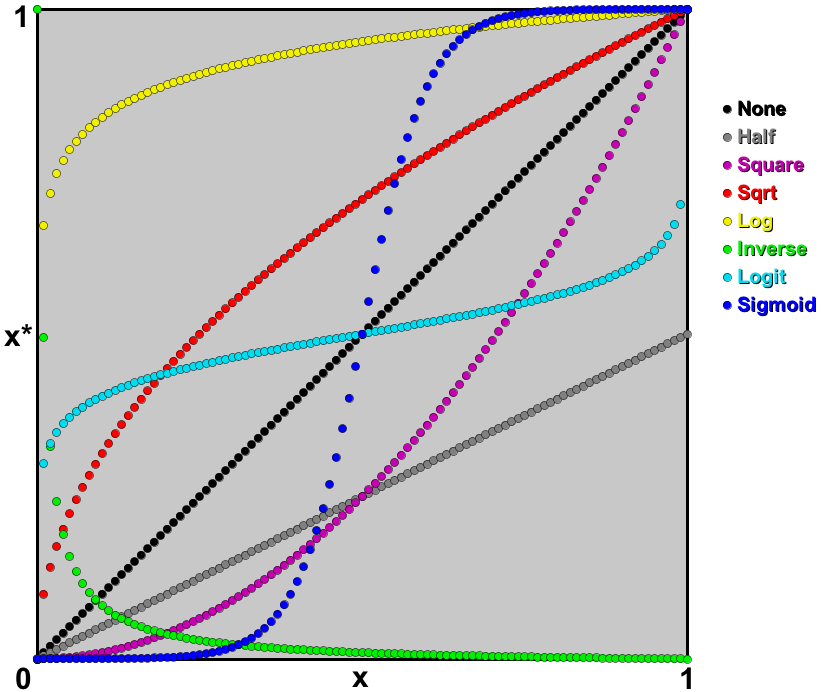
Choice of transformation
- The classical statistical transformations arose out of experiences applying models based on theoretical distributions to real data
- ransformations we choose ought to cover the full range of negative to positive skewness as well as mixtures of distributions that are relatively symmetric
Choice of transformation
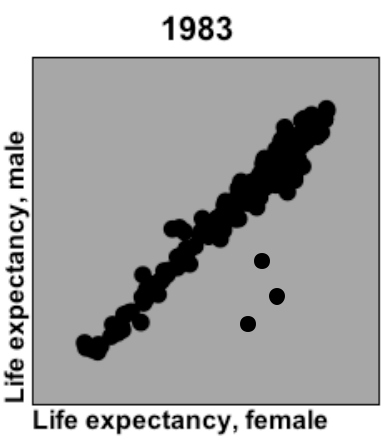
Example: Monotonic
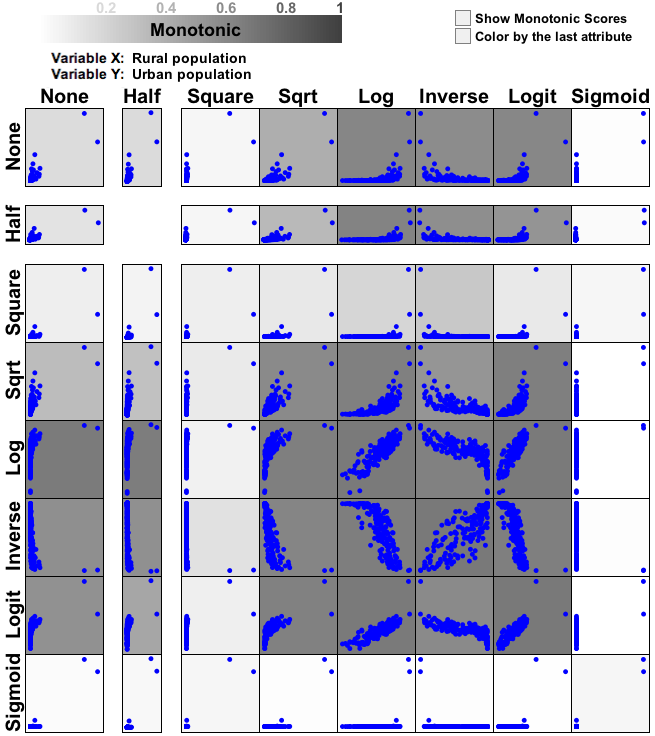 Rural population vs. Urban population from the World Bank data: http://data.worldbank.org/indicator
Case study: Monotonic
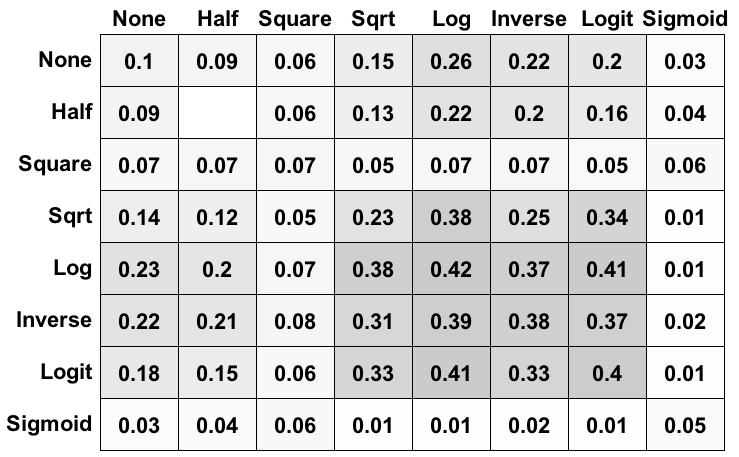
We inspect 100 variables in Economy and Growth from the World Bank data: http://data.worldbank.org/indicator
Case study: Monotonic
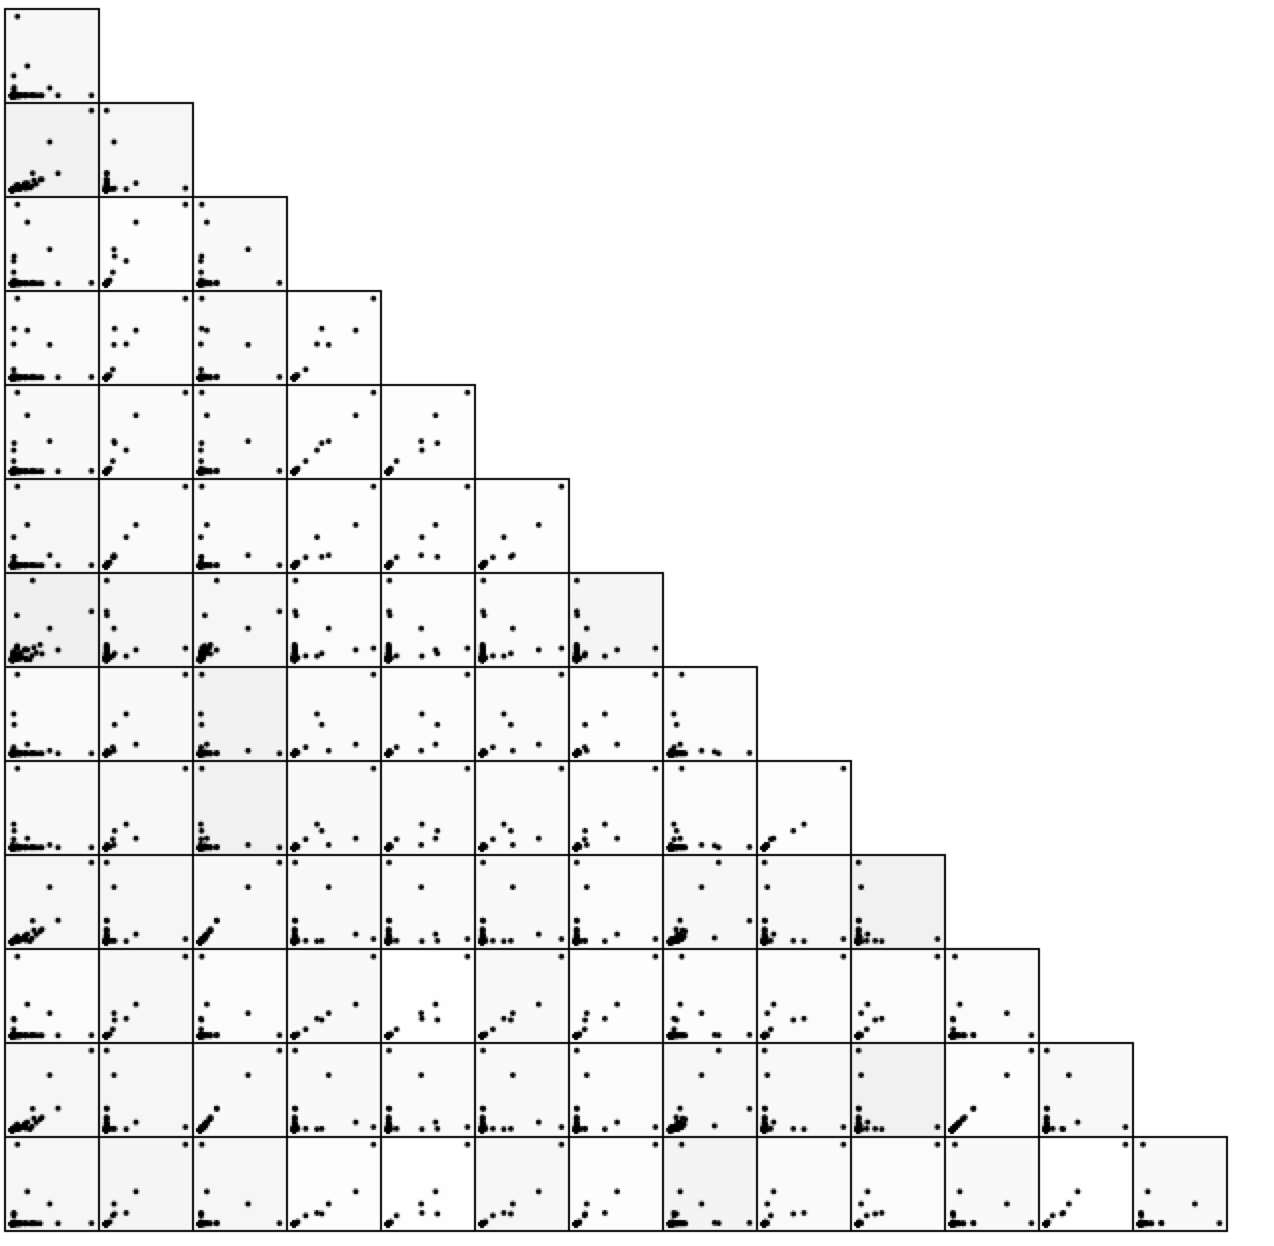
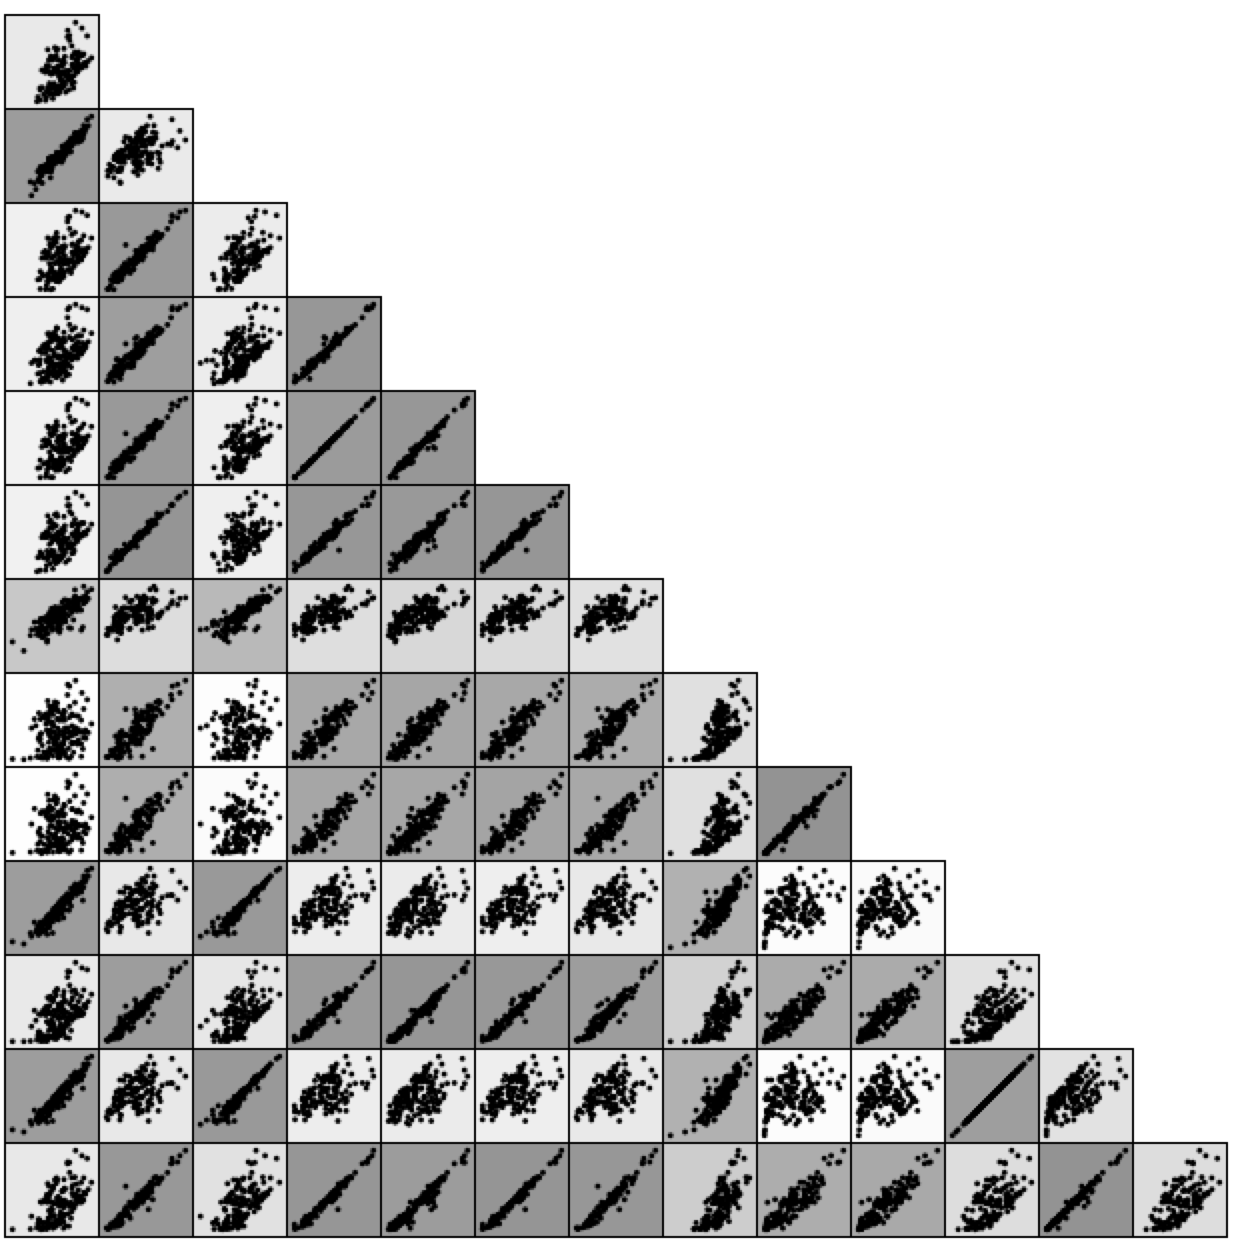
We inspect 100 variables in Economy and Growth from the World Bank data: http://data.worldbank.org/indicator
Using Scagnostics for classification
- Leland Wilkinson, Anushka Anand, and Tuan Dang. CHIRP: A new classifier based on Composite Hypercubes on Iterated Random Projections. Proceedings of the 17th ACM SIGKDD International Conference on Knowledge Discovery and Data Mining, KDD 2011
- Leland Wilkinson, Anushka Anand, and Tuan Dang. Substantial improvements in the set-covering projection classifier CHIRP. Journal ACM Transactions on Knowledge Discovery from Data, TKDD 2012

CHIRP is maintained on Weka: http://weka.sourceforge.net/packageMetaData/CHIRP/index.html
Outline
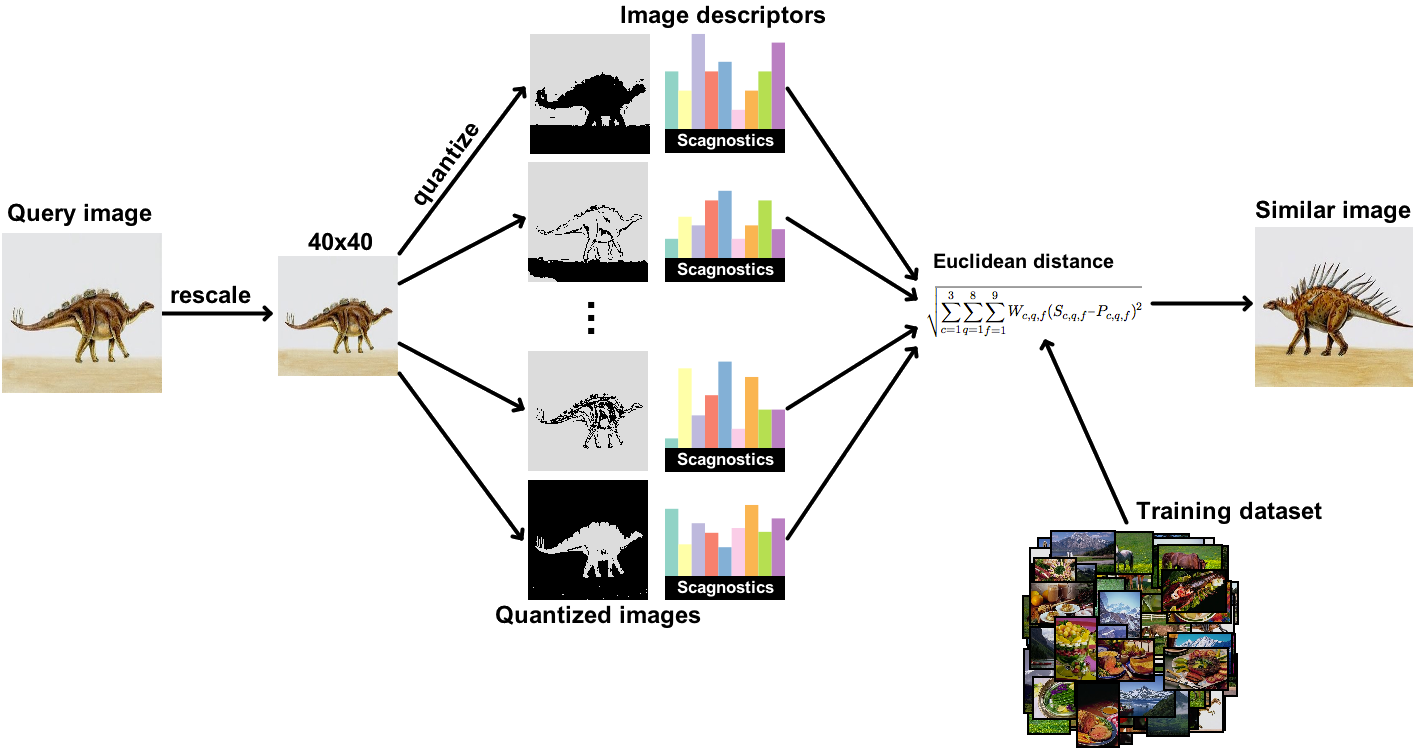
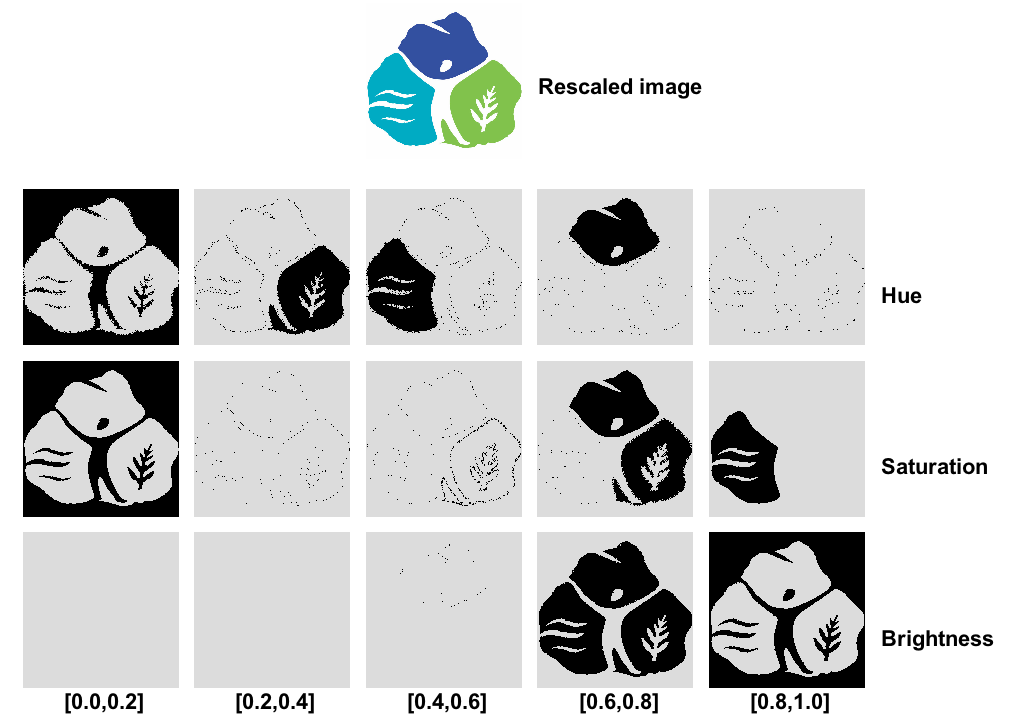
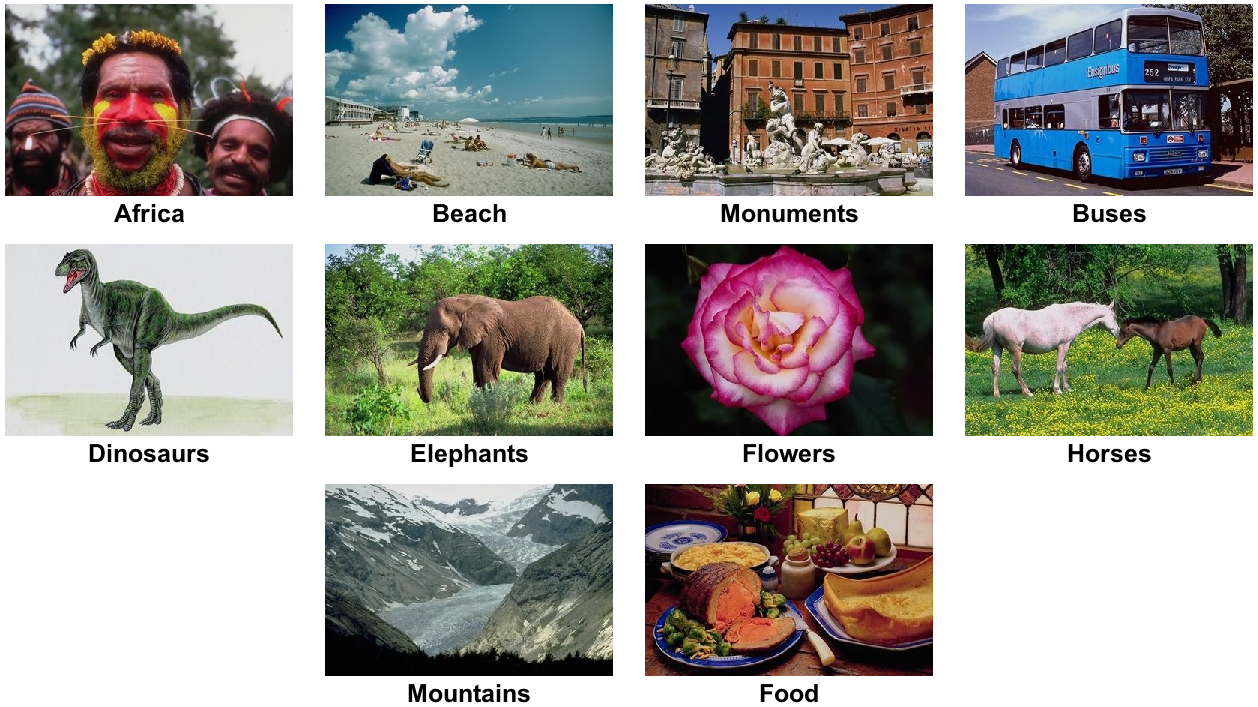
Testing dataset: Wang
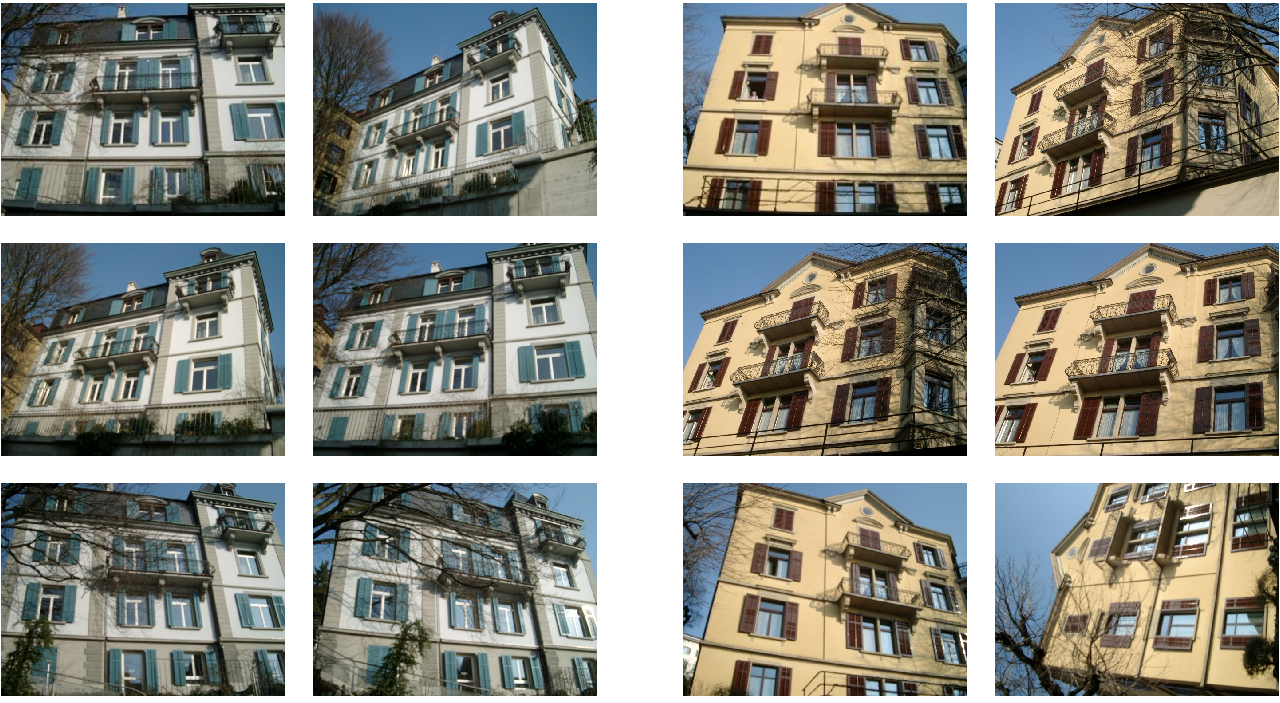
Testing dataset: ZuBuD
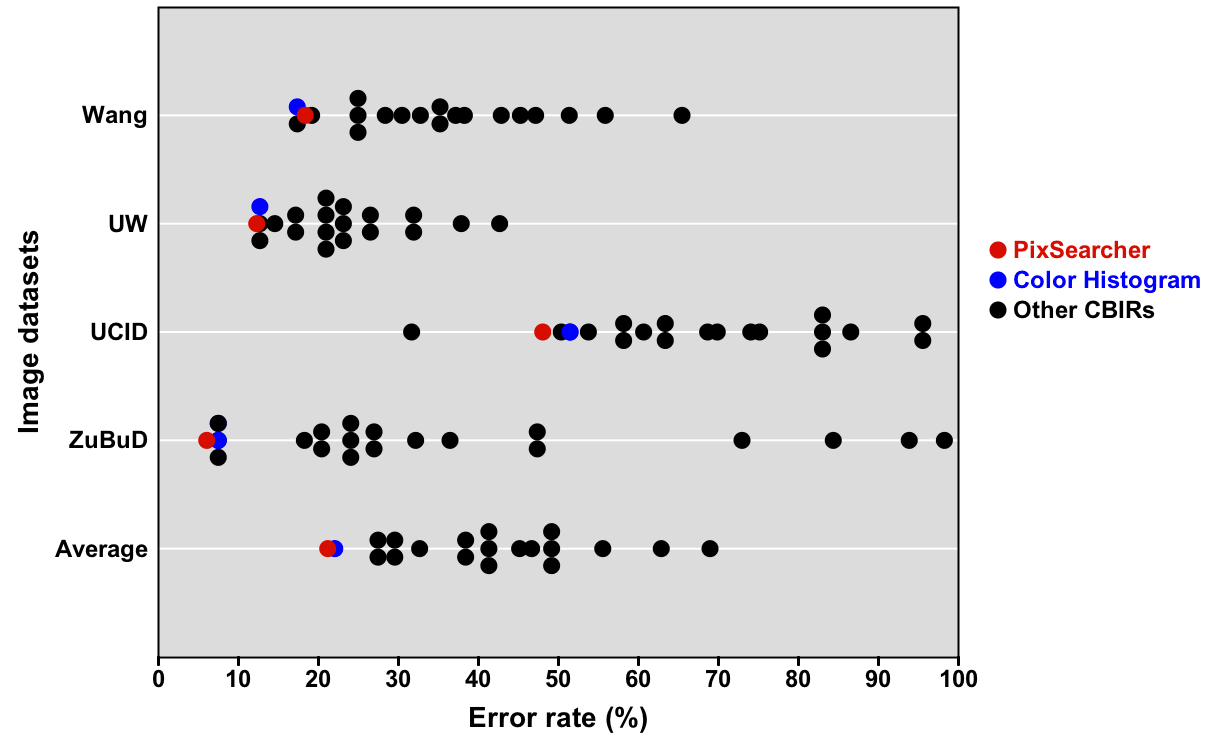
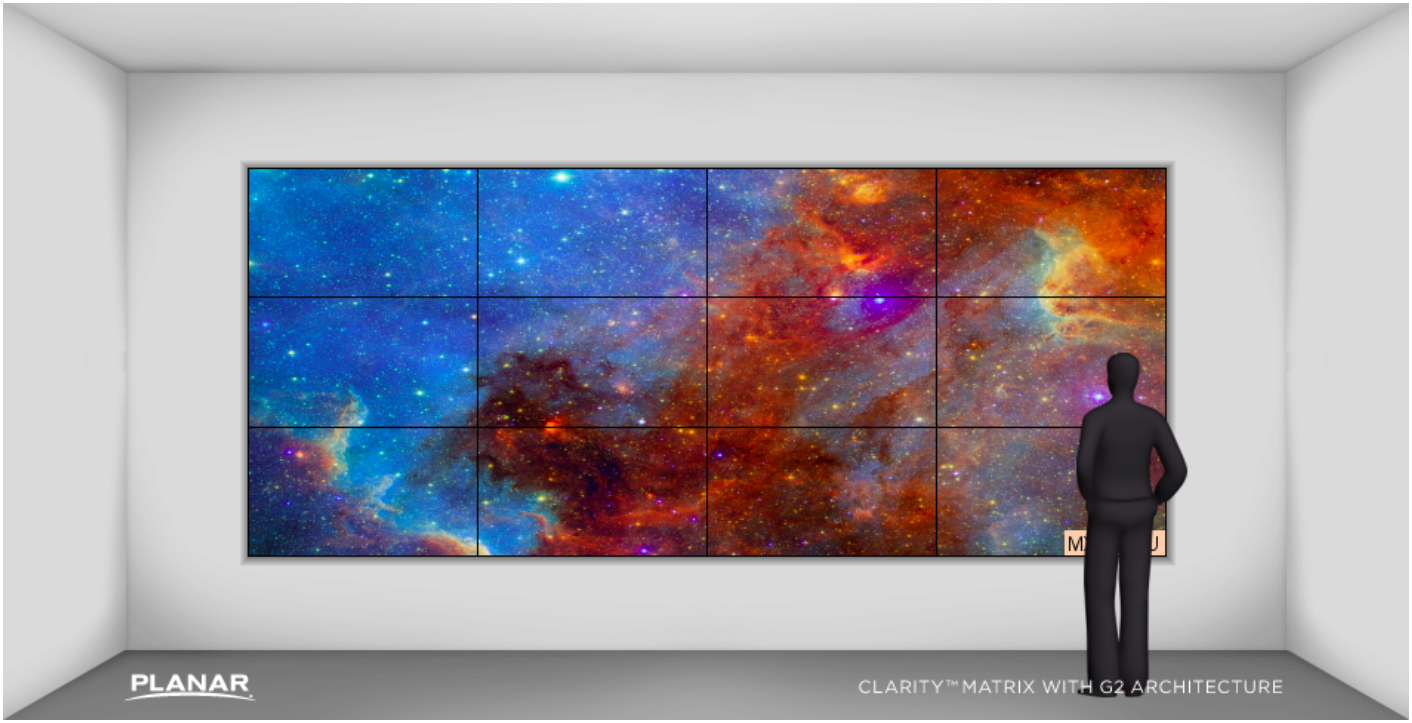
Comparison of different Image Retrieval systems
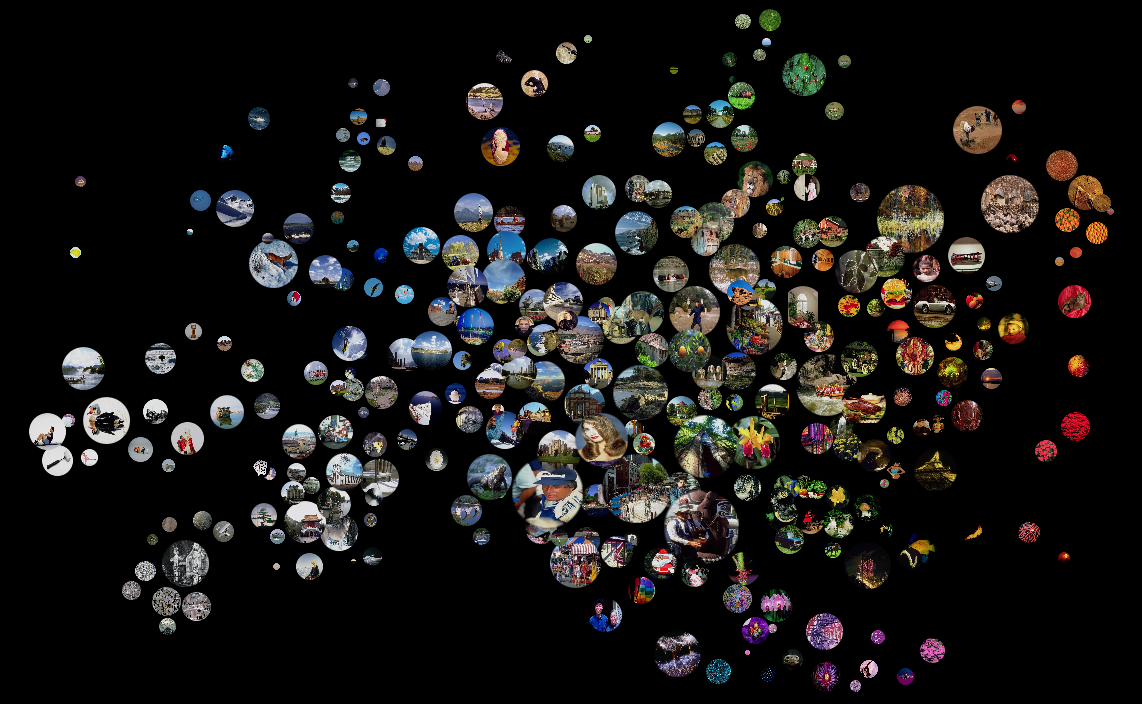
Demo: 1,000 images in the Wang collection
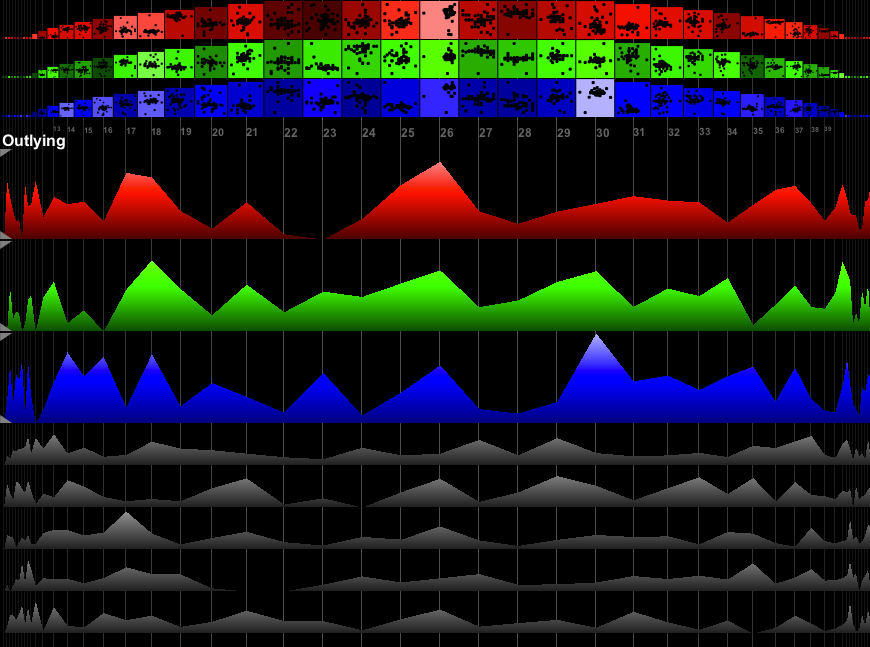
Demo on SETI plots
Examples of SETI Waterfall Plots
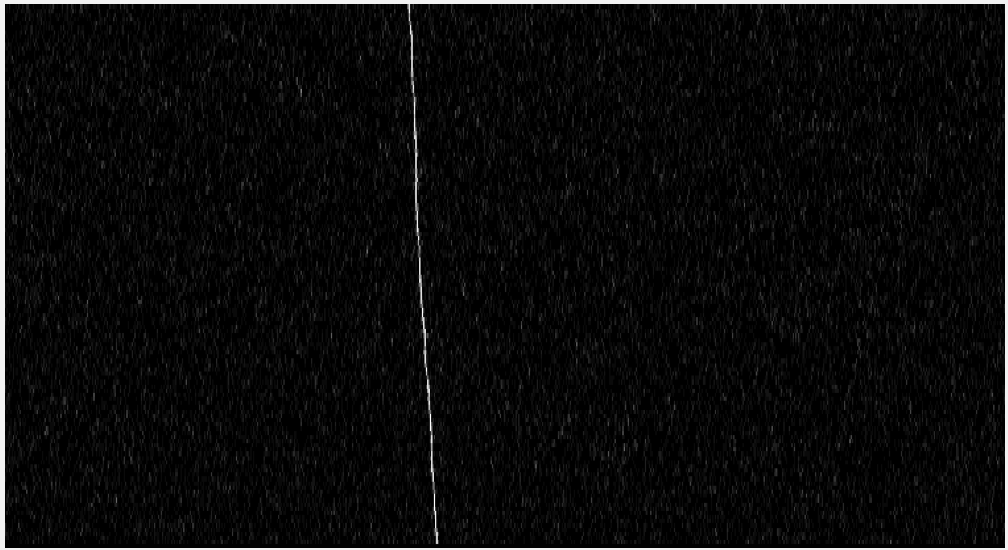
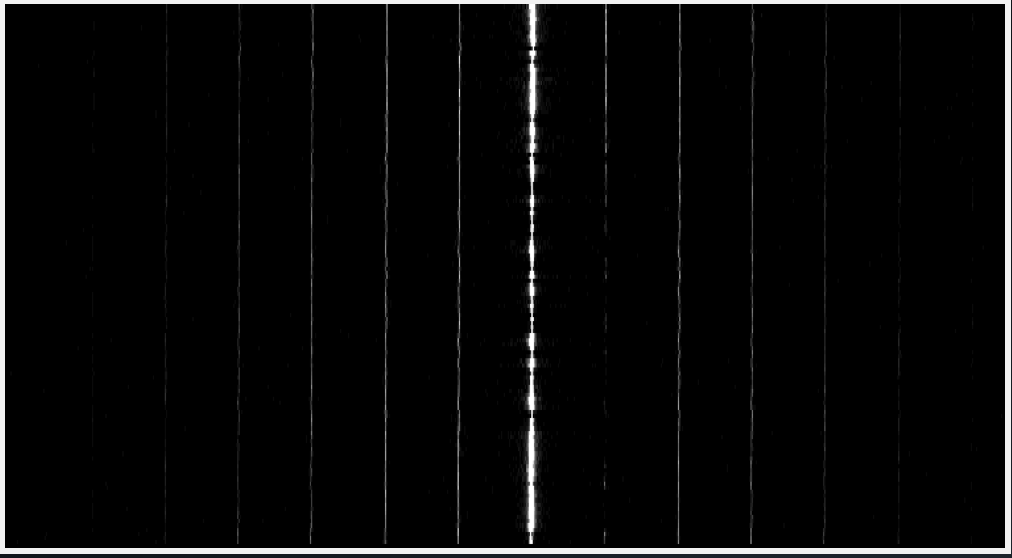
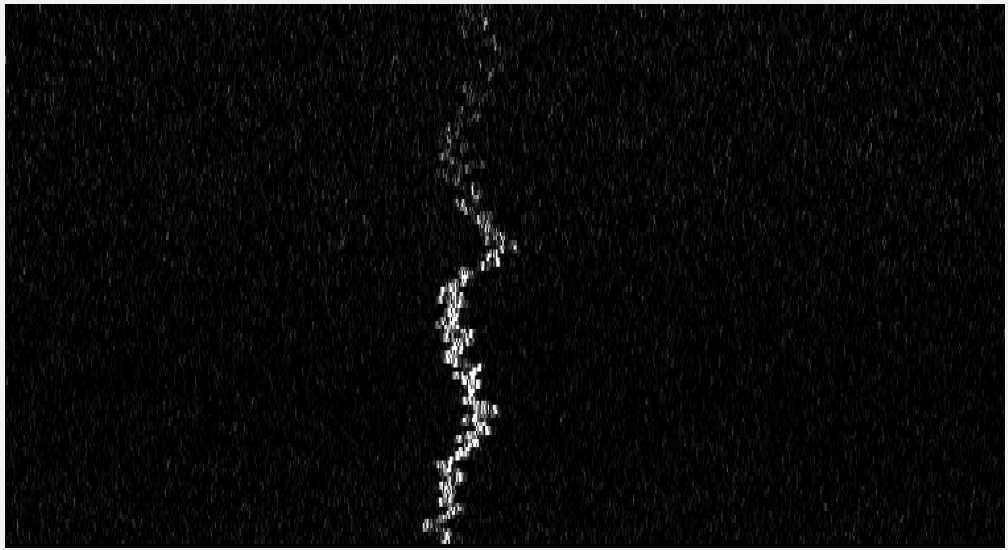 More information on Waterfall_plot: http://setiquest.org/wiki/index.php/
Outline
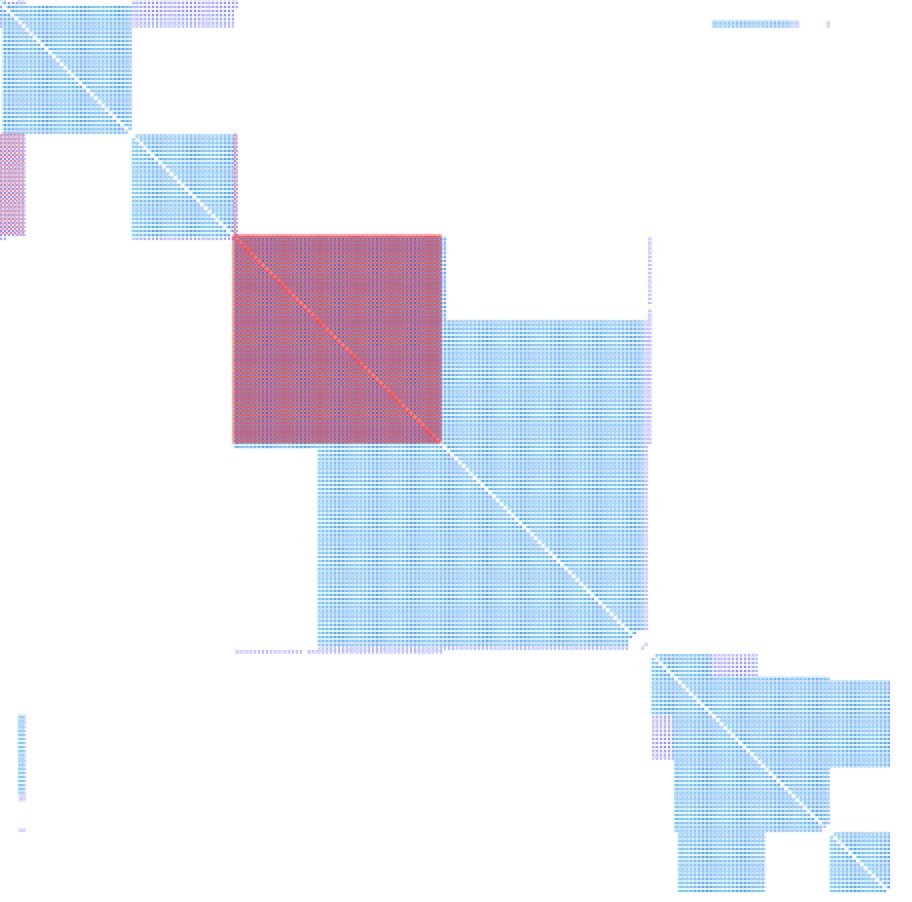
Pathway Matrix (BioVis 2015)
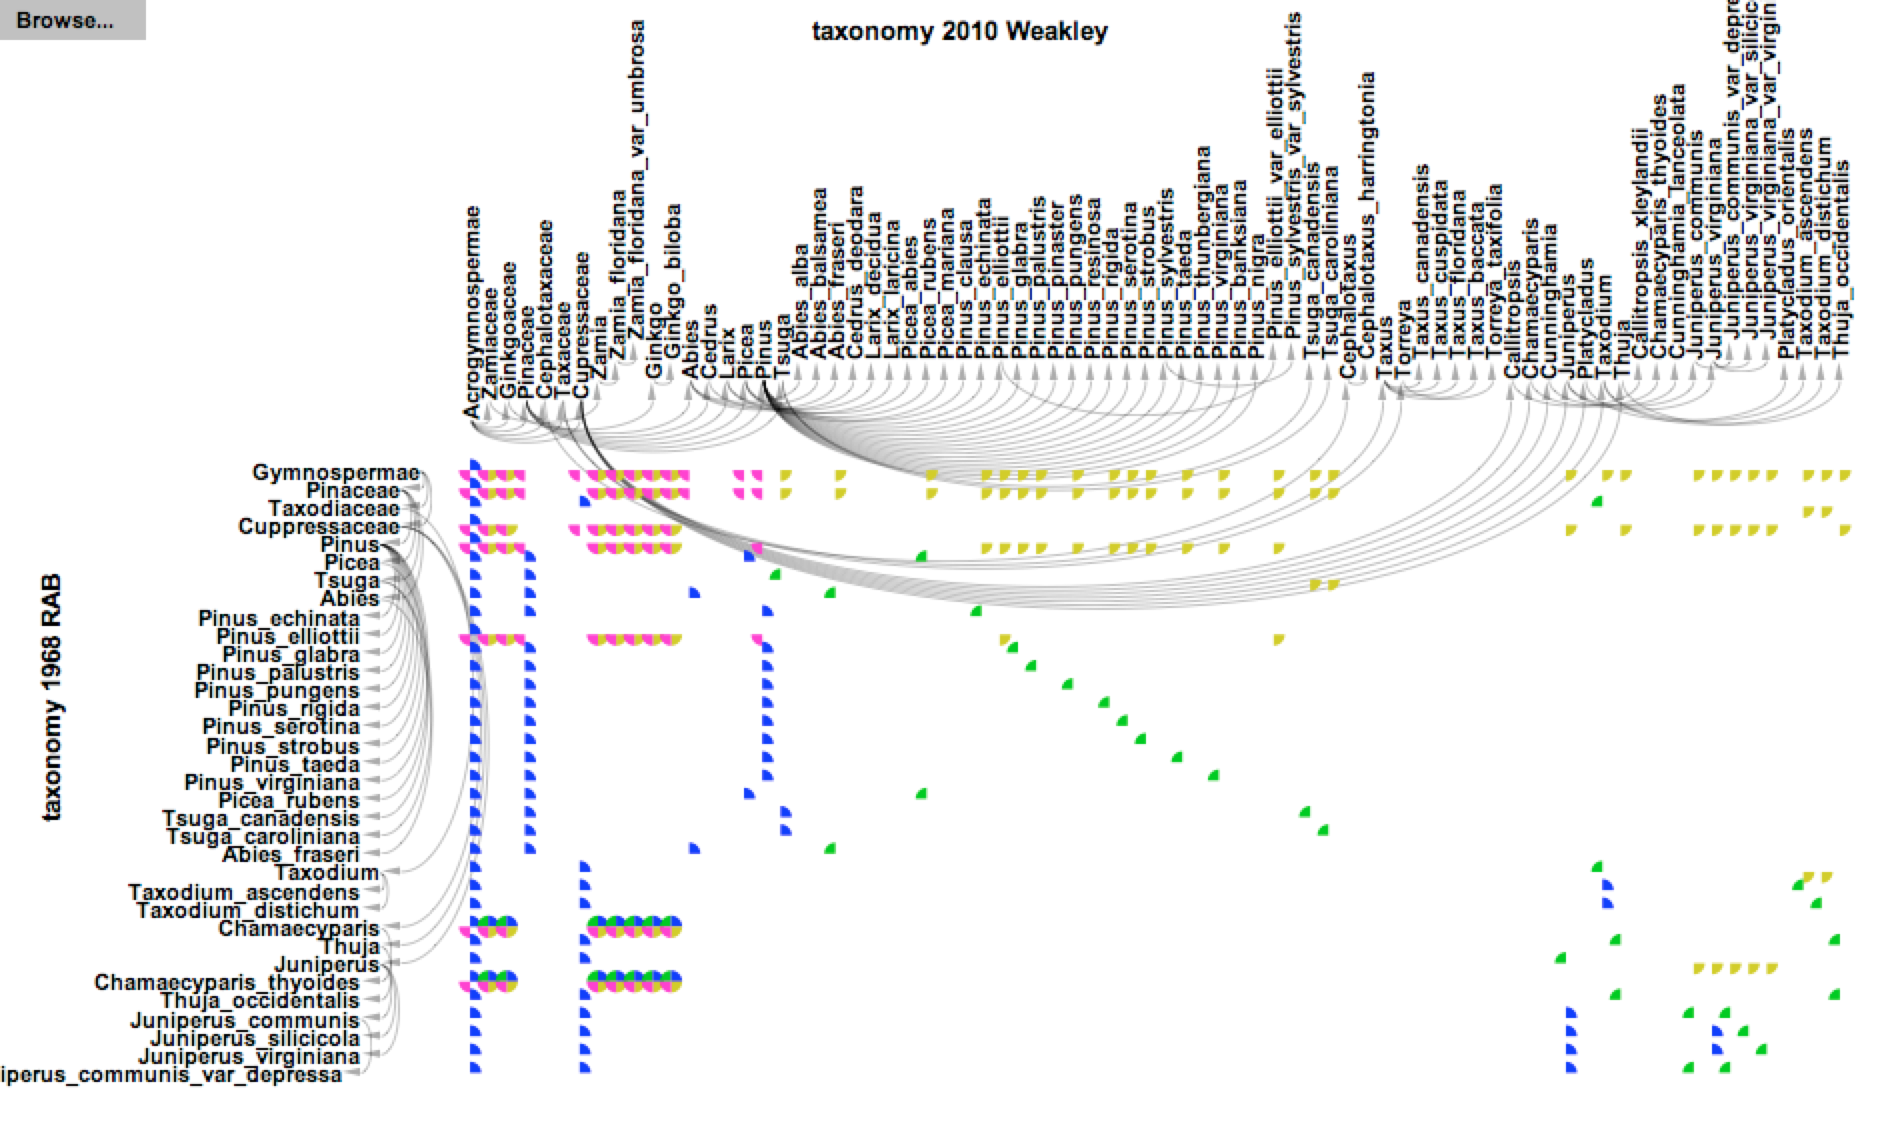
Provenance Matrix (VOILA 2015)
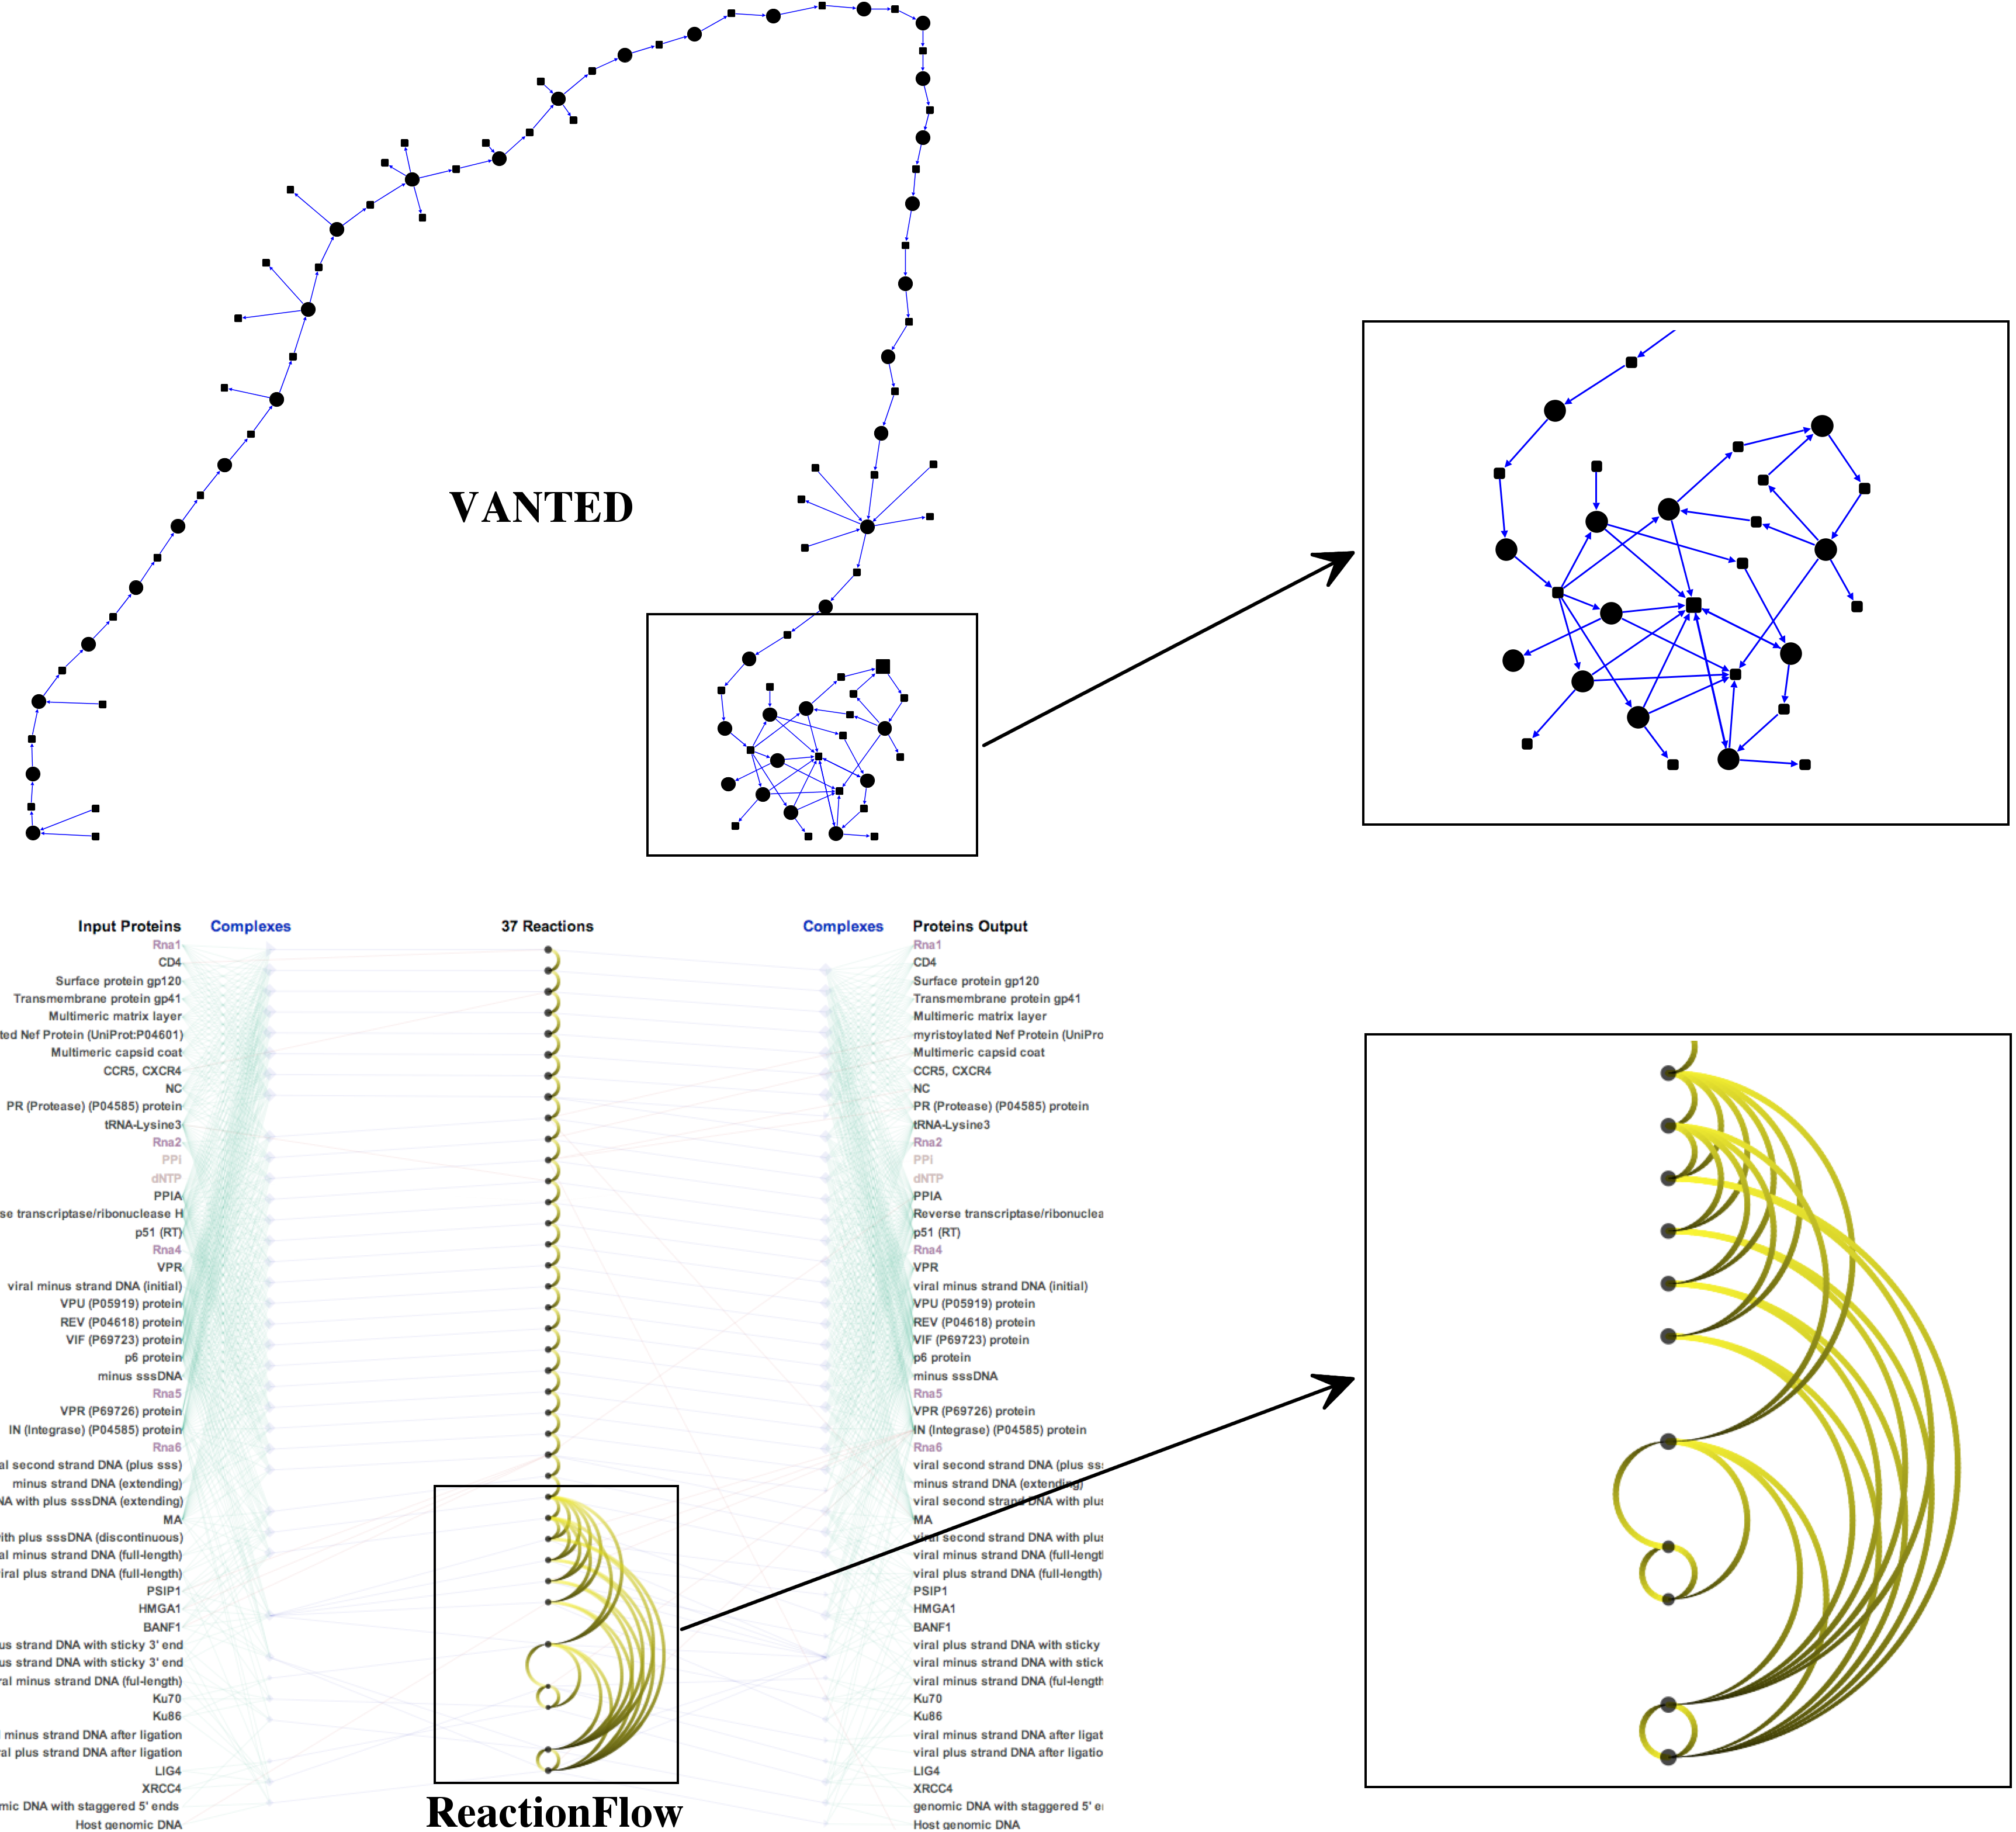
Reaction Flow (BioVis 2015)
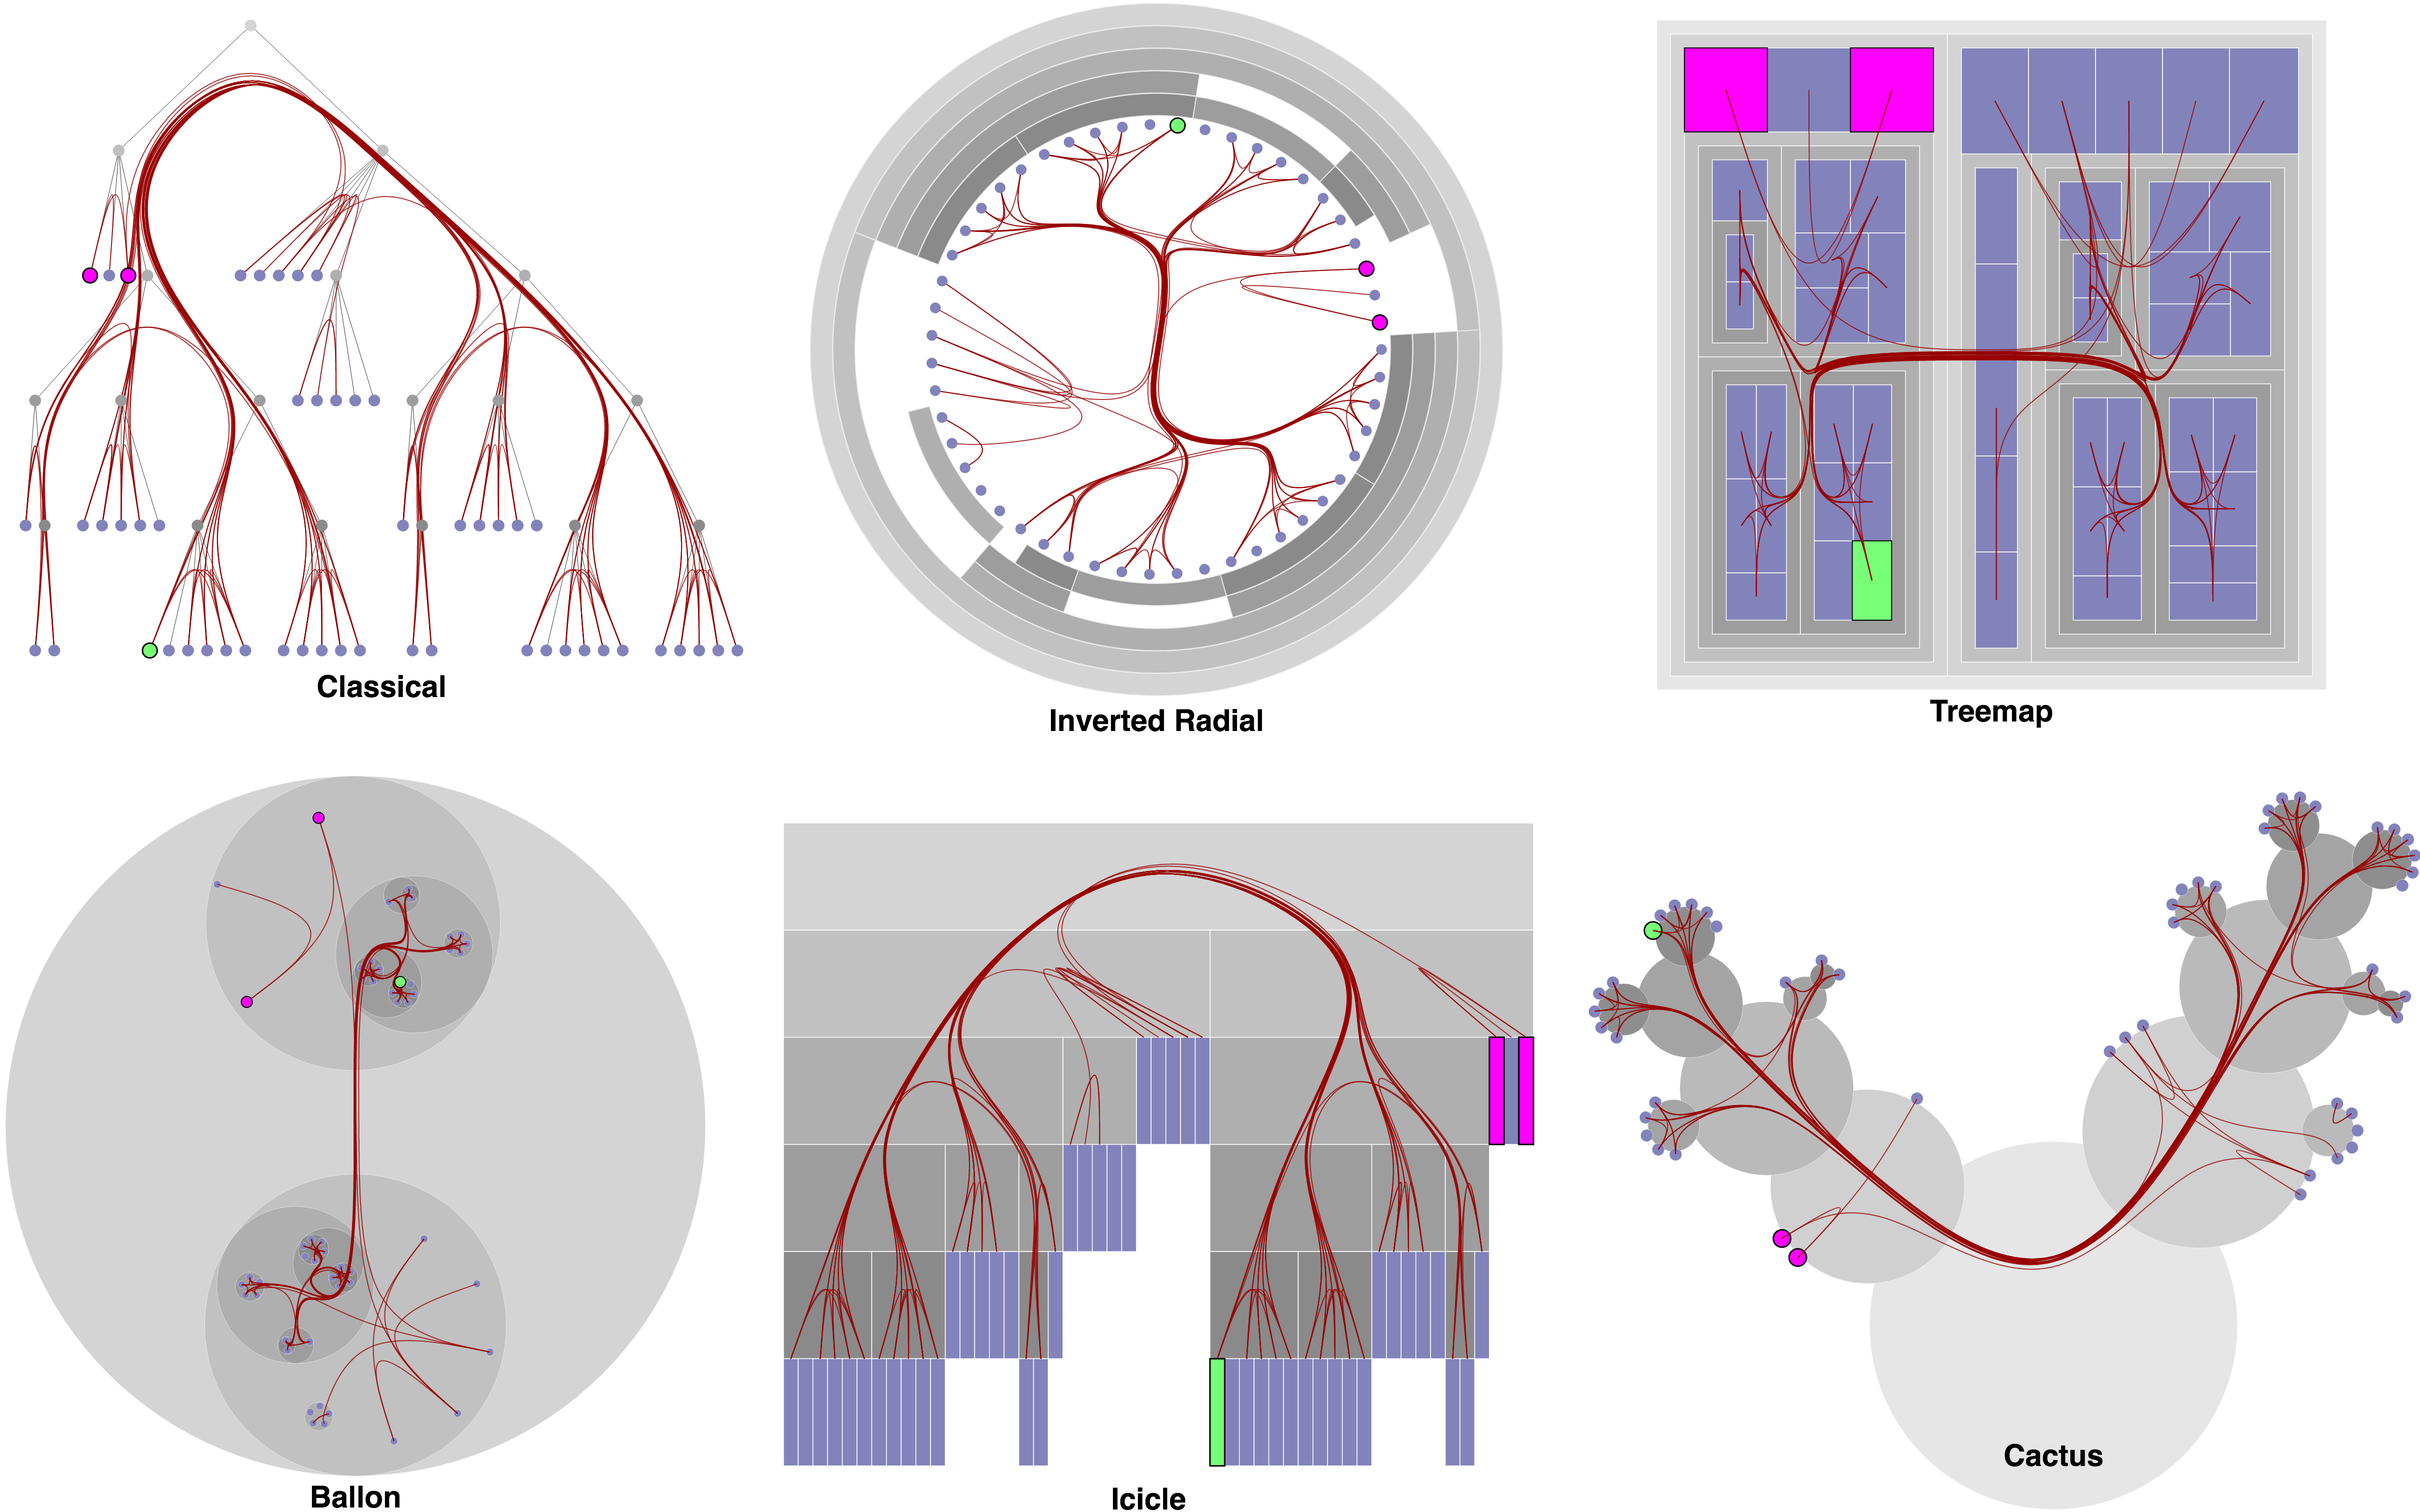
Networks and structures
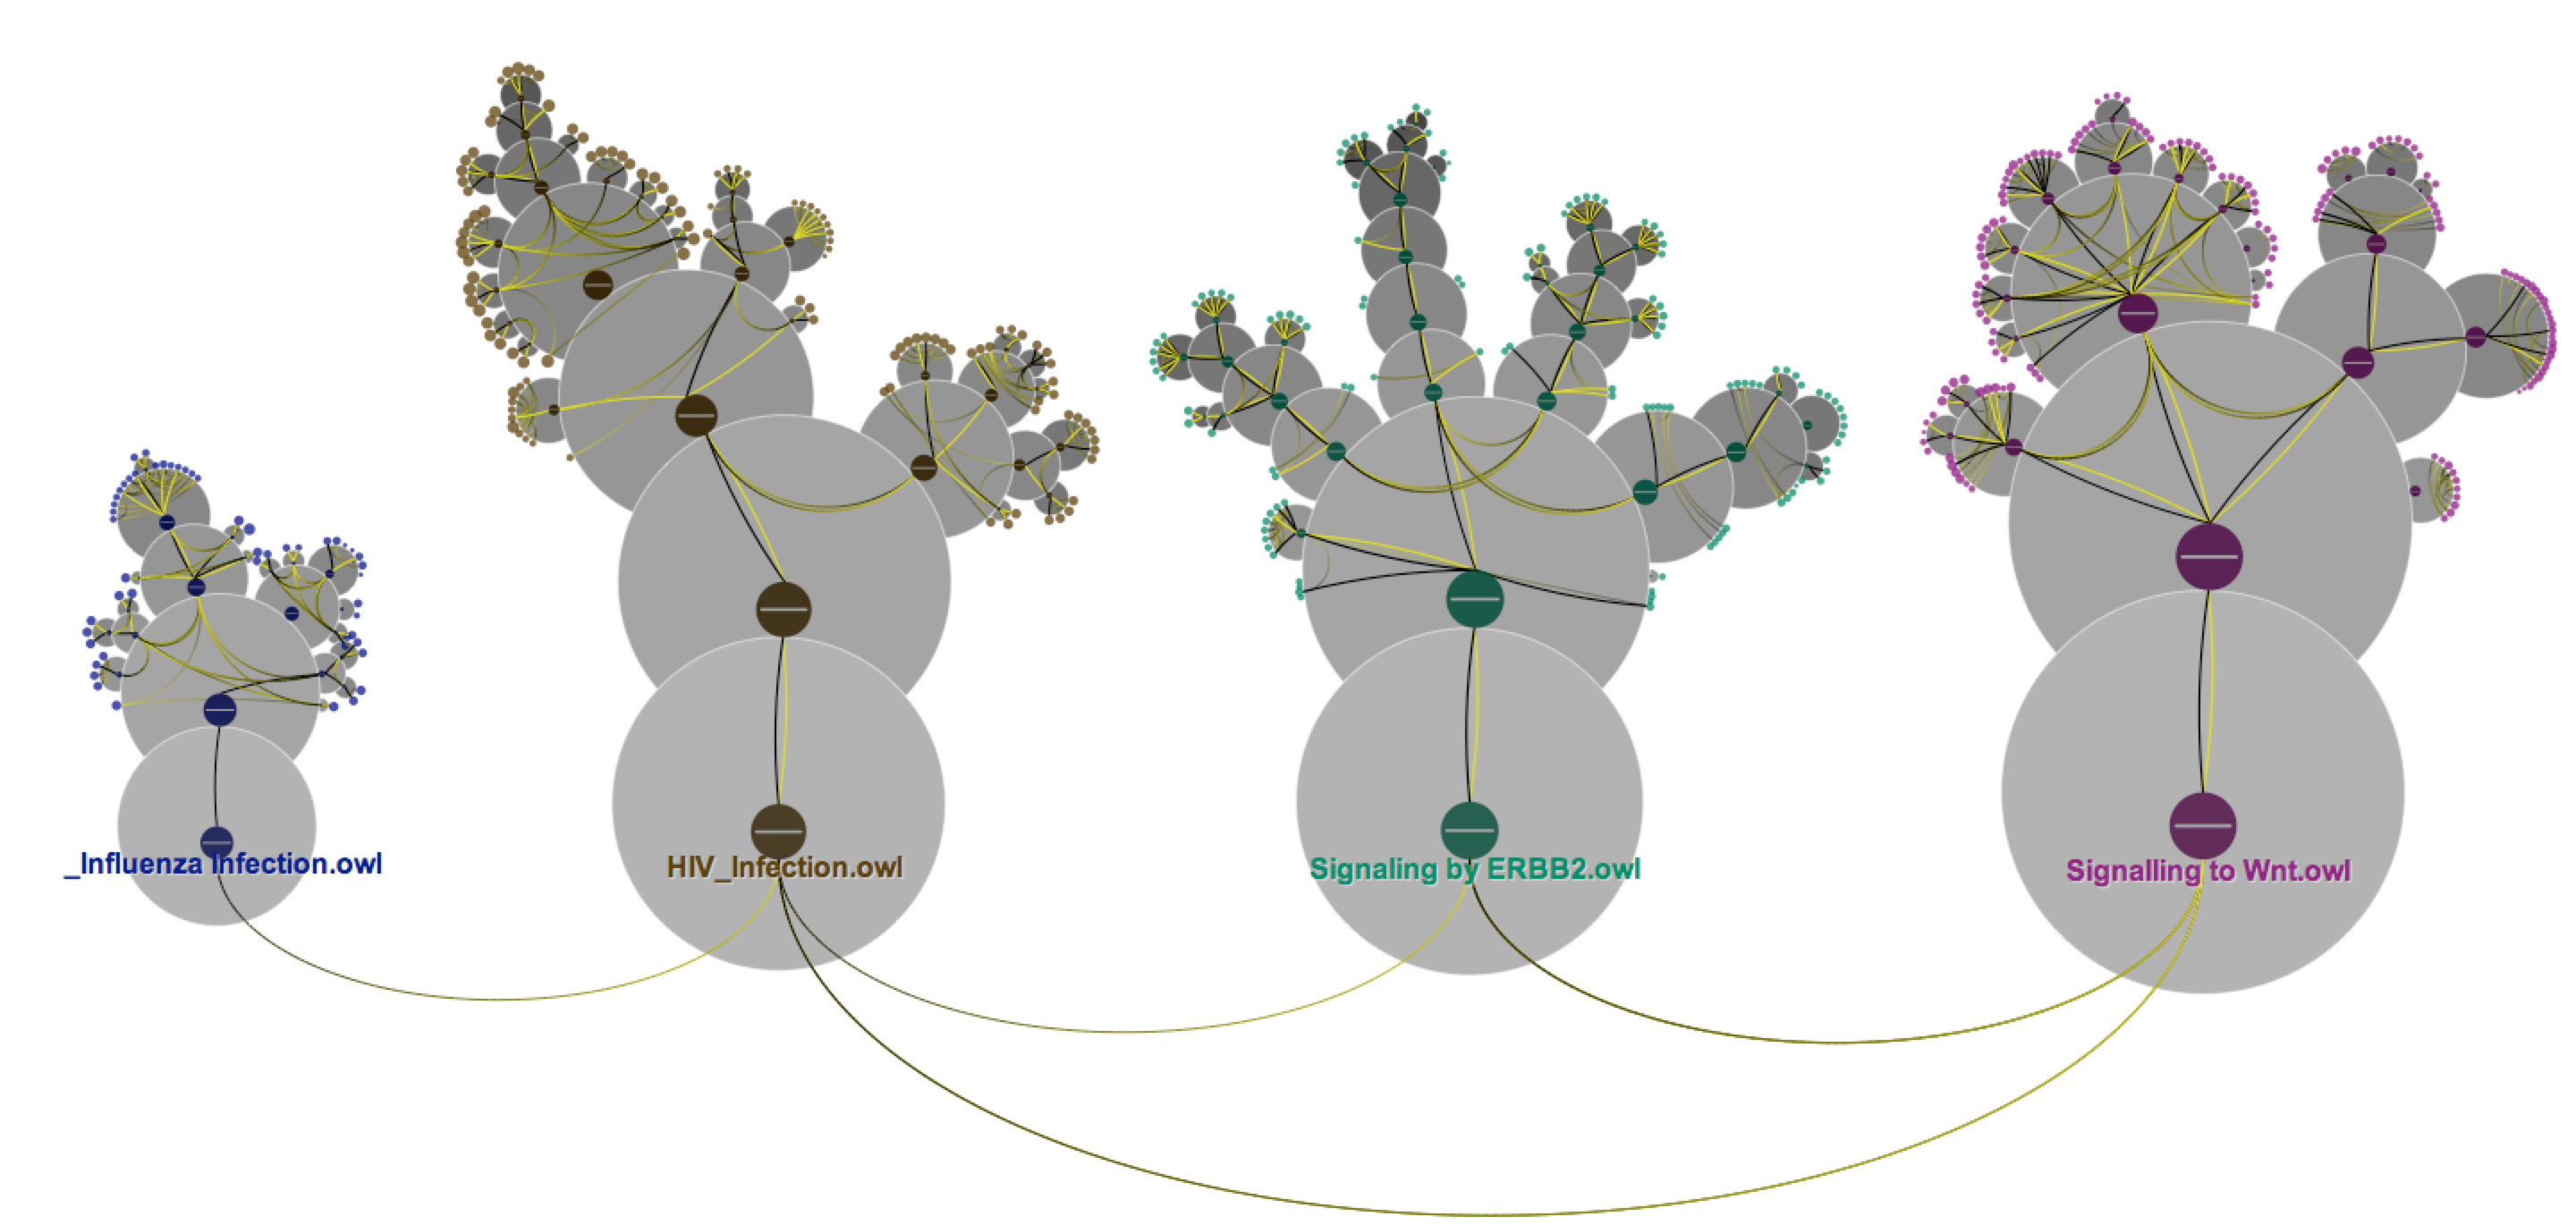
User study of Tree layouts
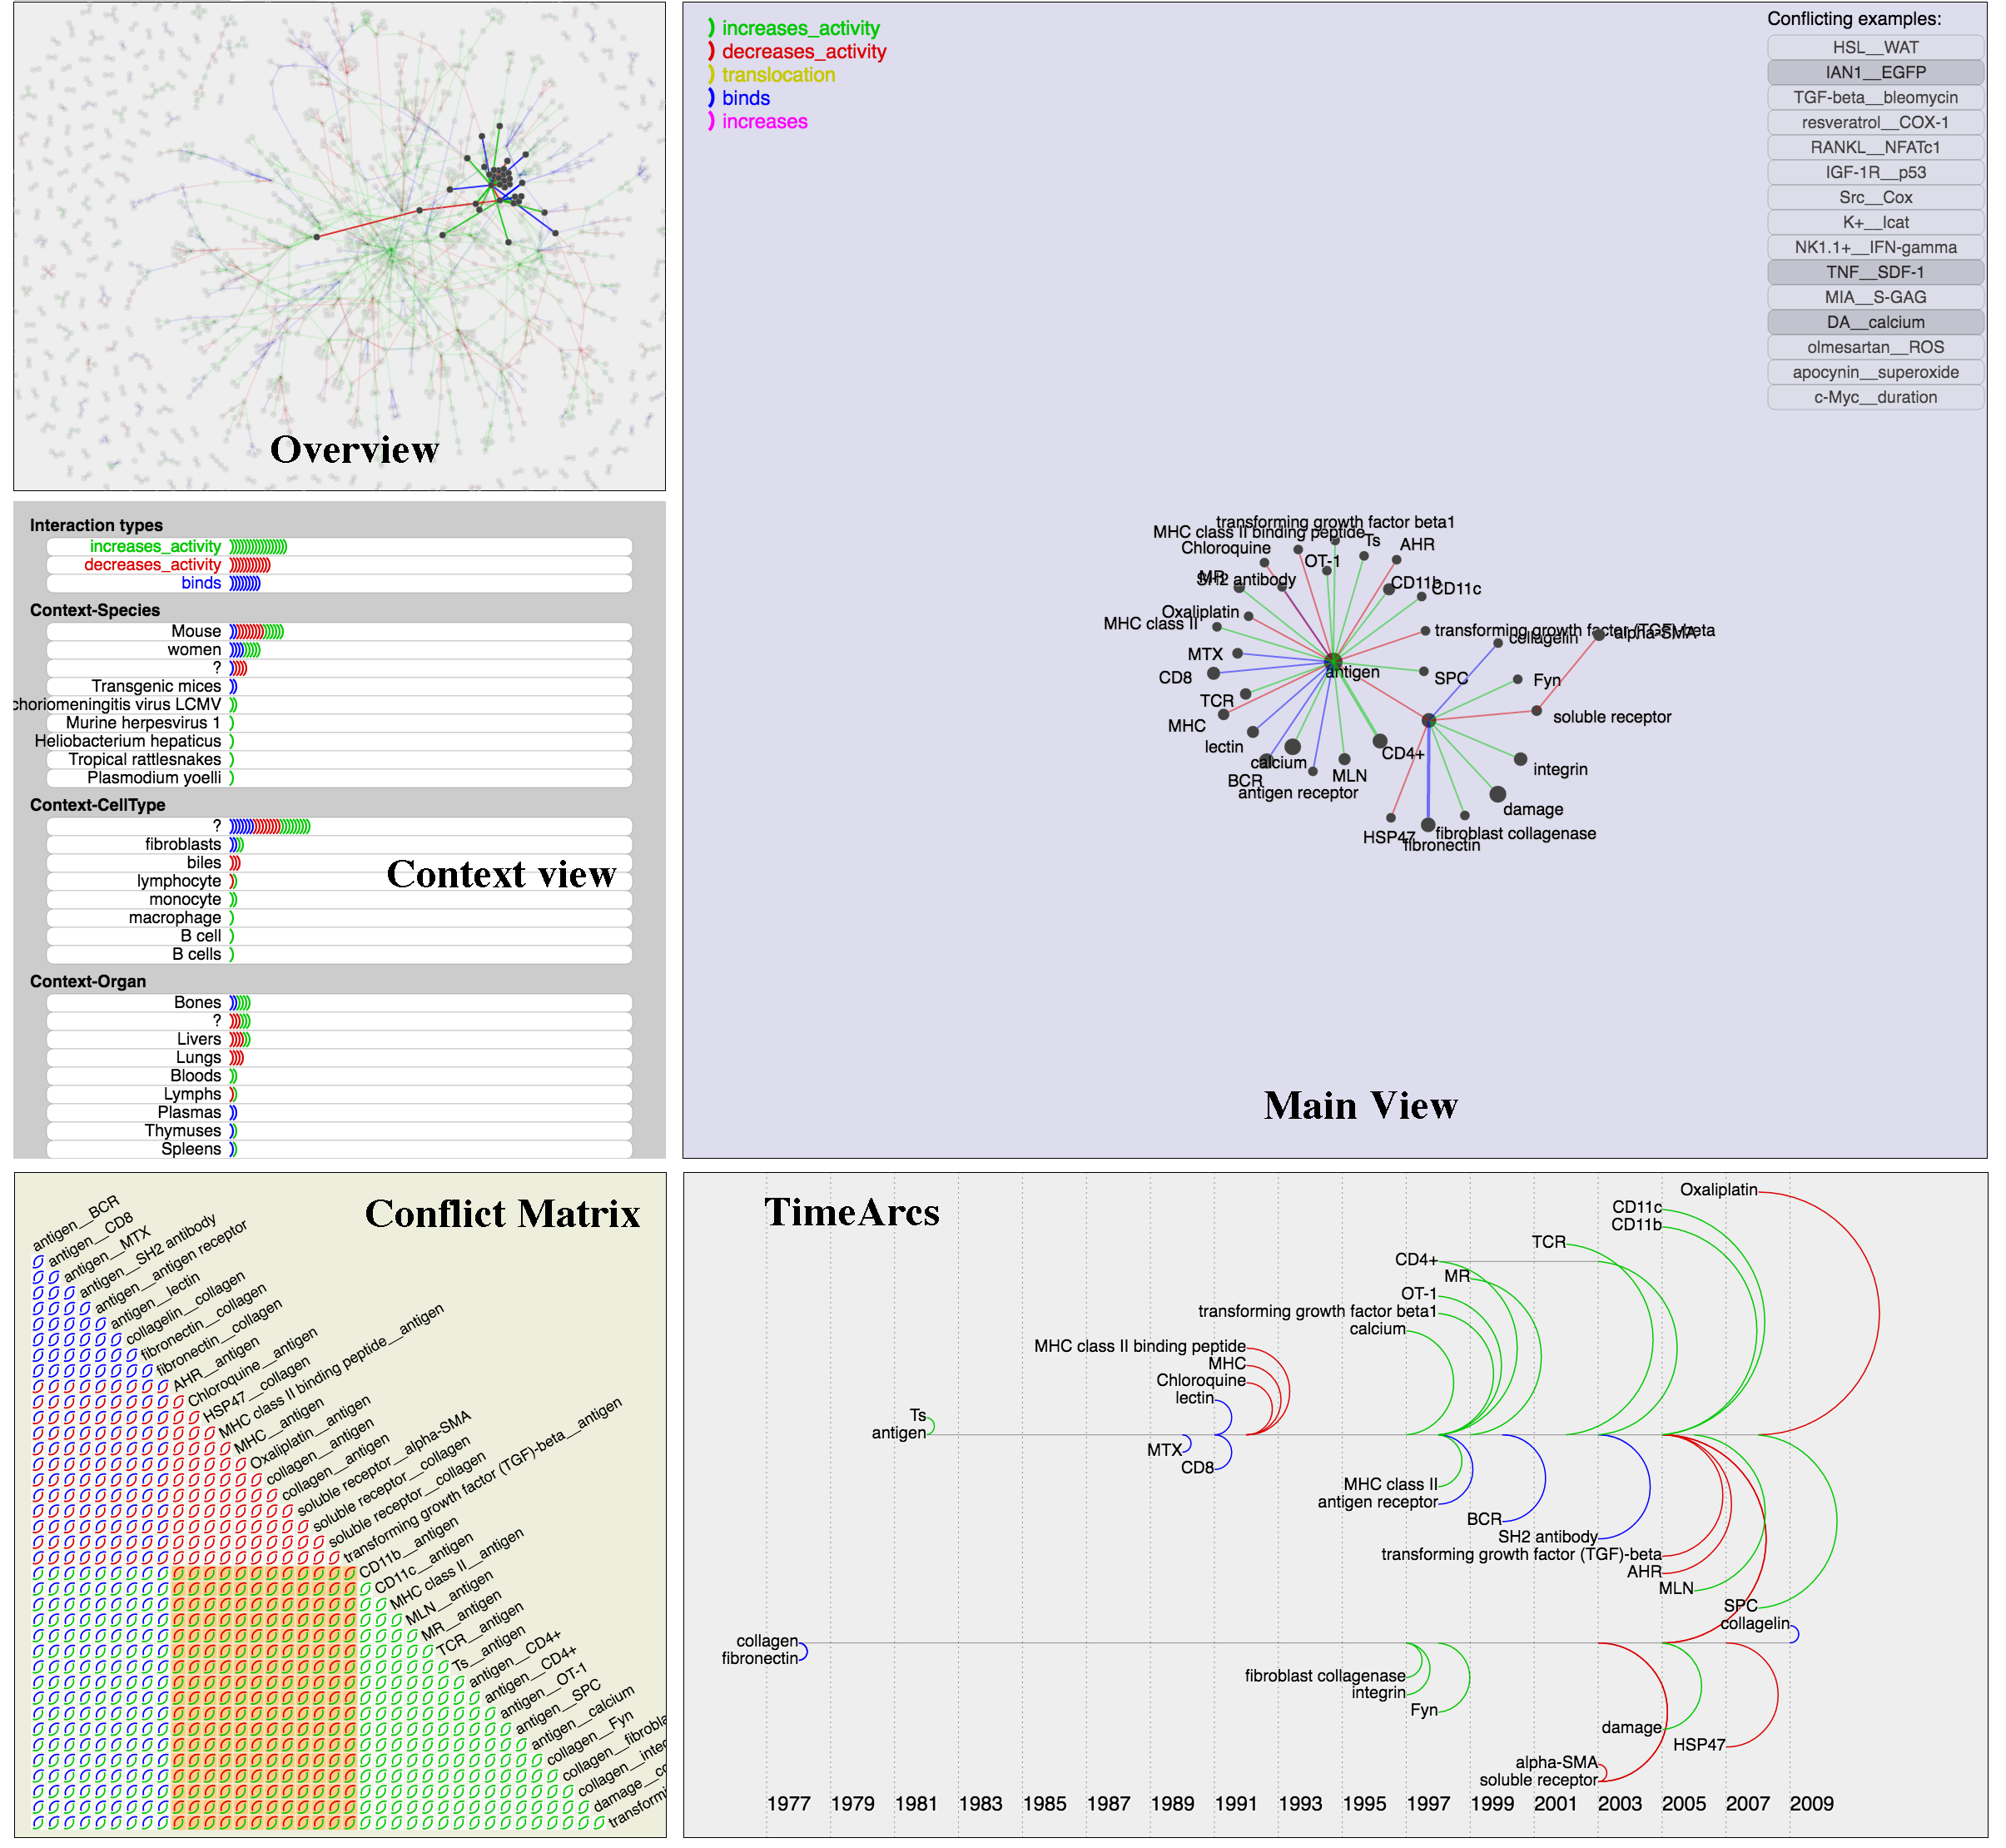
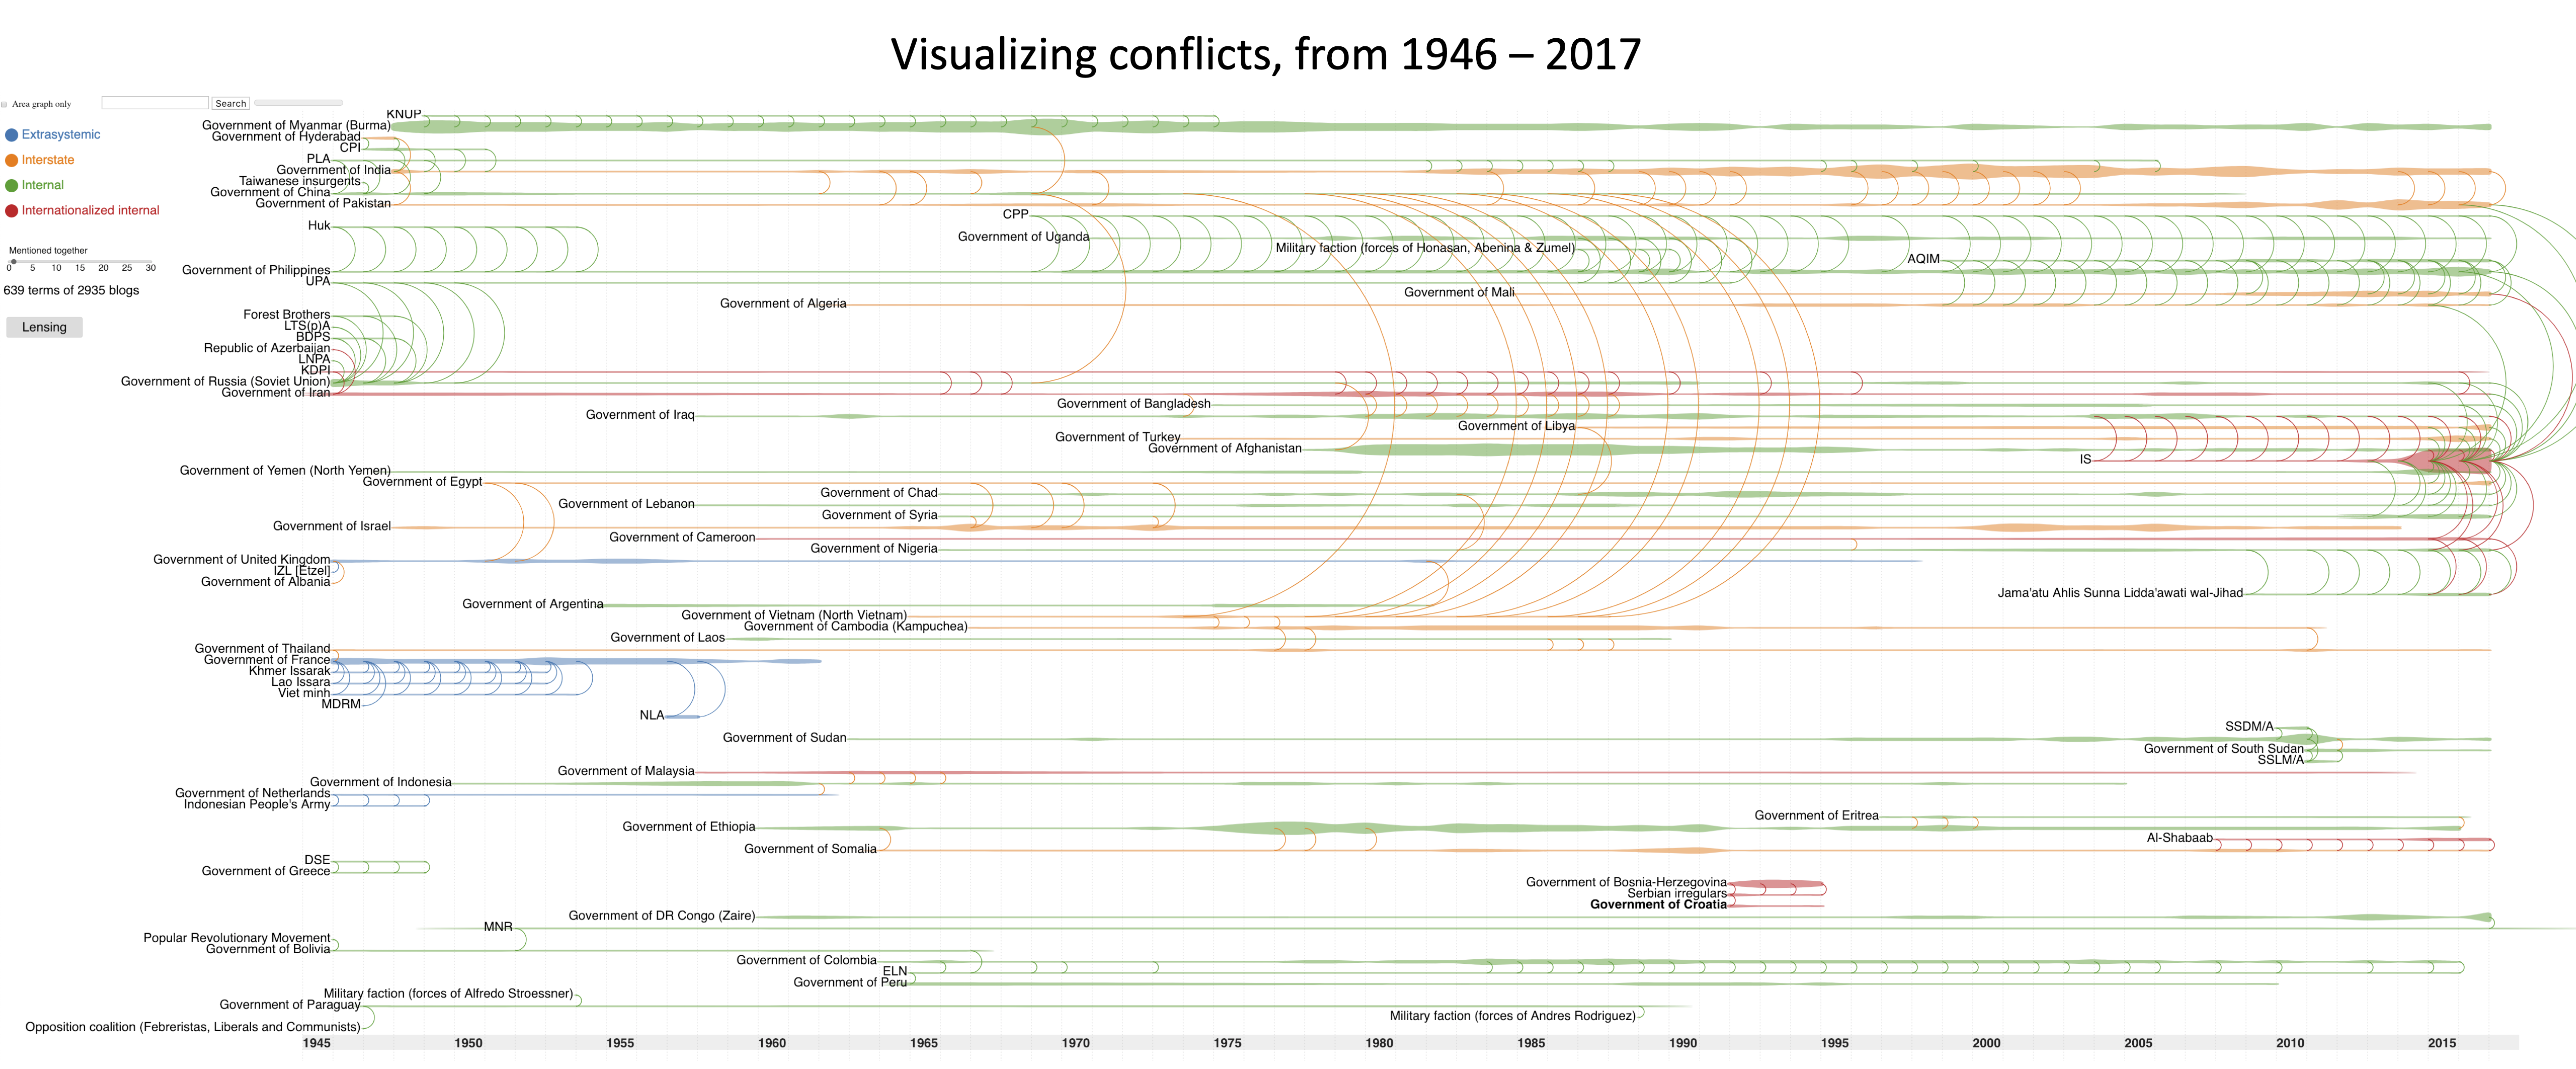
Visualizing dynamic networks
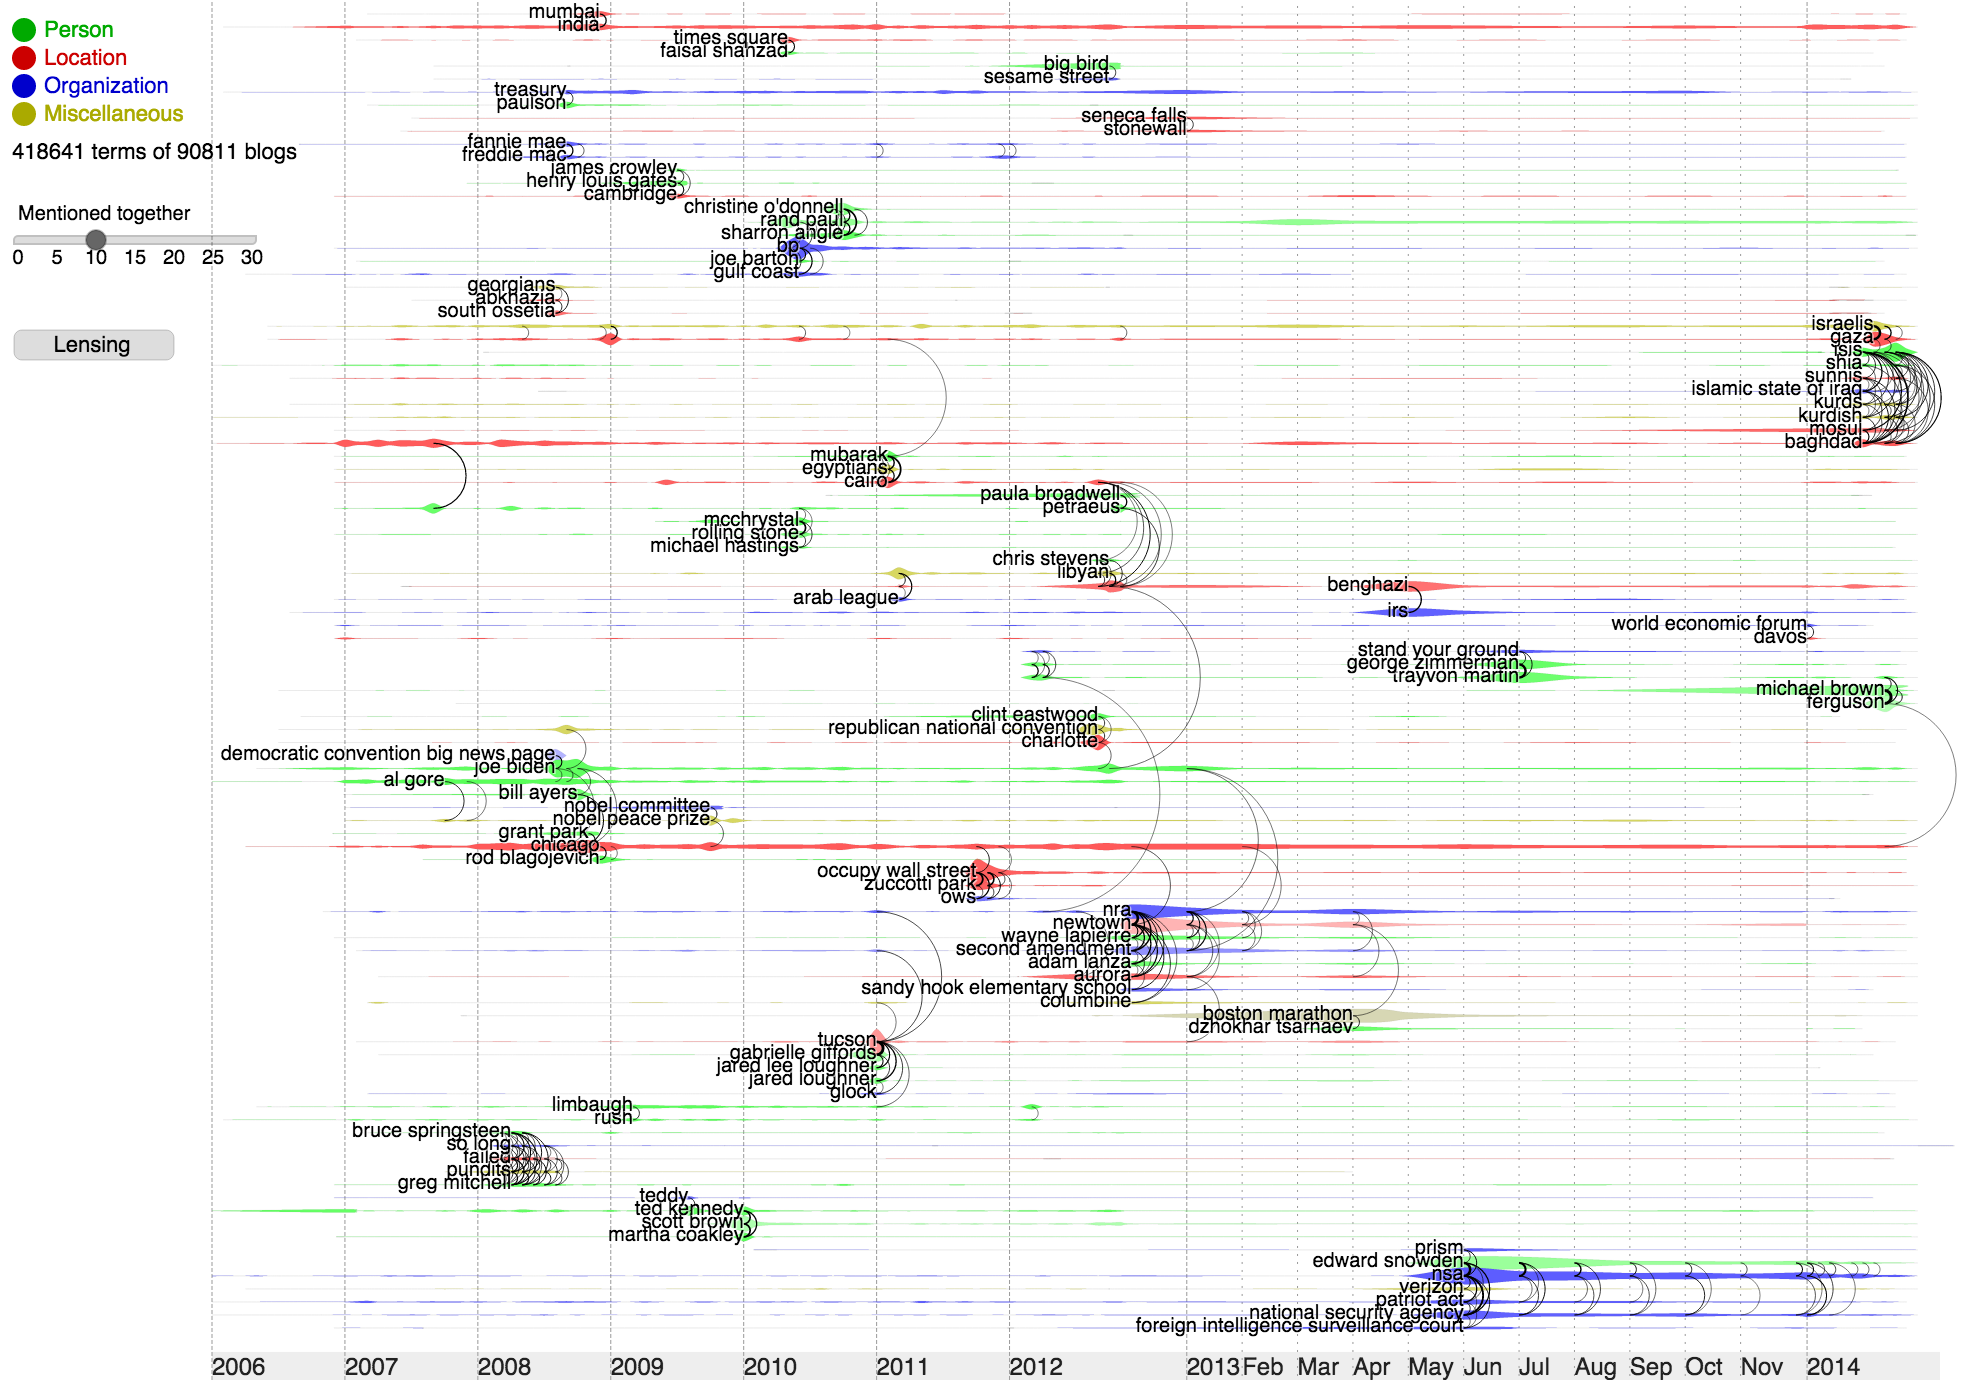 TimeArcs github repository: http://github.com/CreativeCodingLab/TimeArcs
TimeArcs
Questions?
Email: Tommy.Dang@ttu.edu
 This work was supported by NSF/DHS grant DMS-FODAVA-0808860 and DARPA Big Mechanism Program under ARO contract WF911NF-14-1-0395
BioLinker