Tommy Dang
Assistant Professor
Department of Computer Science
Texas Tech University
Big Data Visualization, visual analytics, and Virtual Reality
Vung Van Pham, PhD student (Data visualization and visual analytics)
Vinh The Nguyen, PhD student (VR and AR)
Geospatial-temporal visualizations
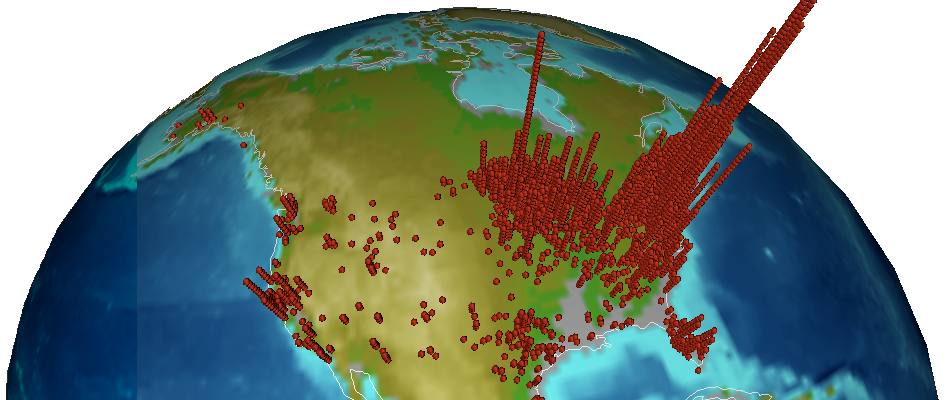
Visualizing the distribution of Lyme diseases in 3D reported in
the U.S. in 2005, 2006, and 2007 by the CDC. One might argue that a county-level choropleth map would
be a suitable presentation. Nevertheless, it would be hard to argue that a county-level choropleth map using hue
or brightness could reveal the threefold increase in Lyme disease cases centered around New England vs. the Midwest.
Networks and structures
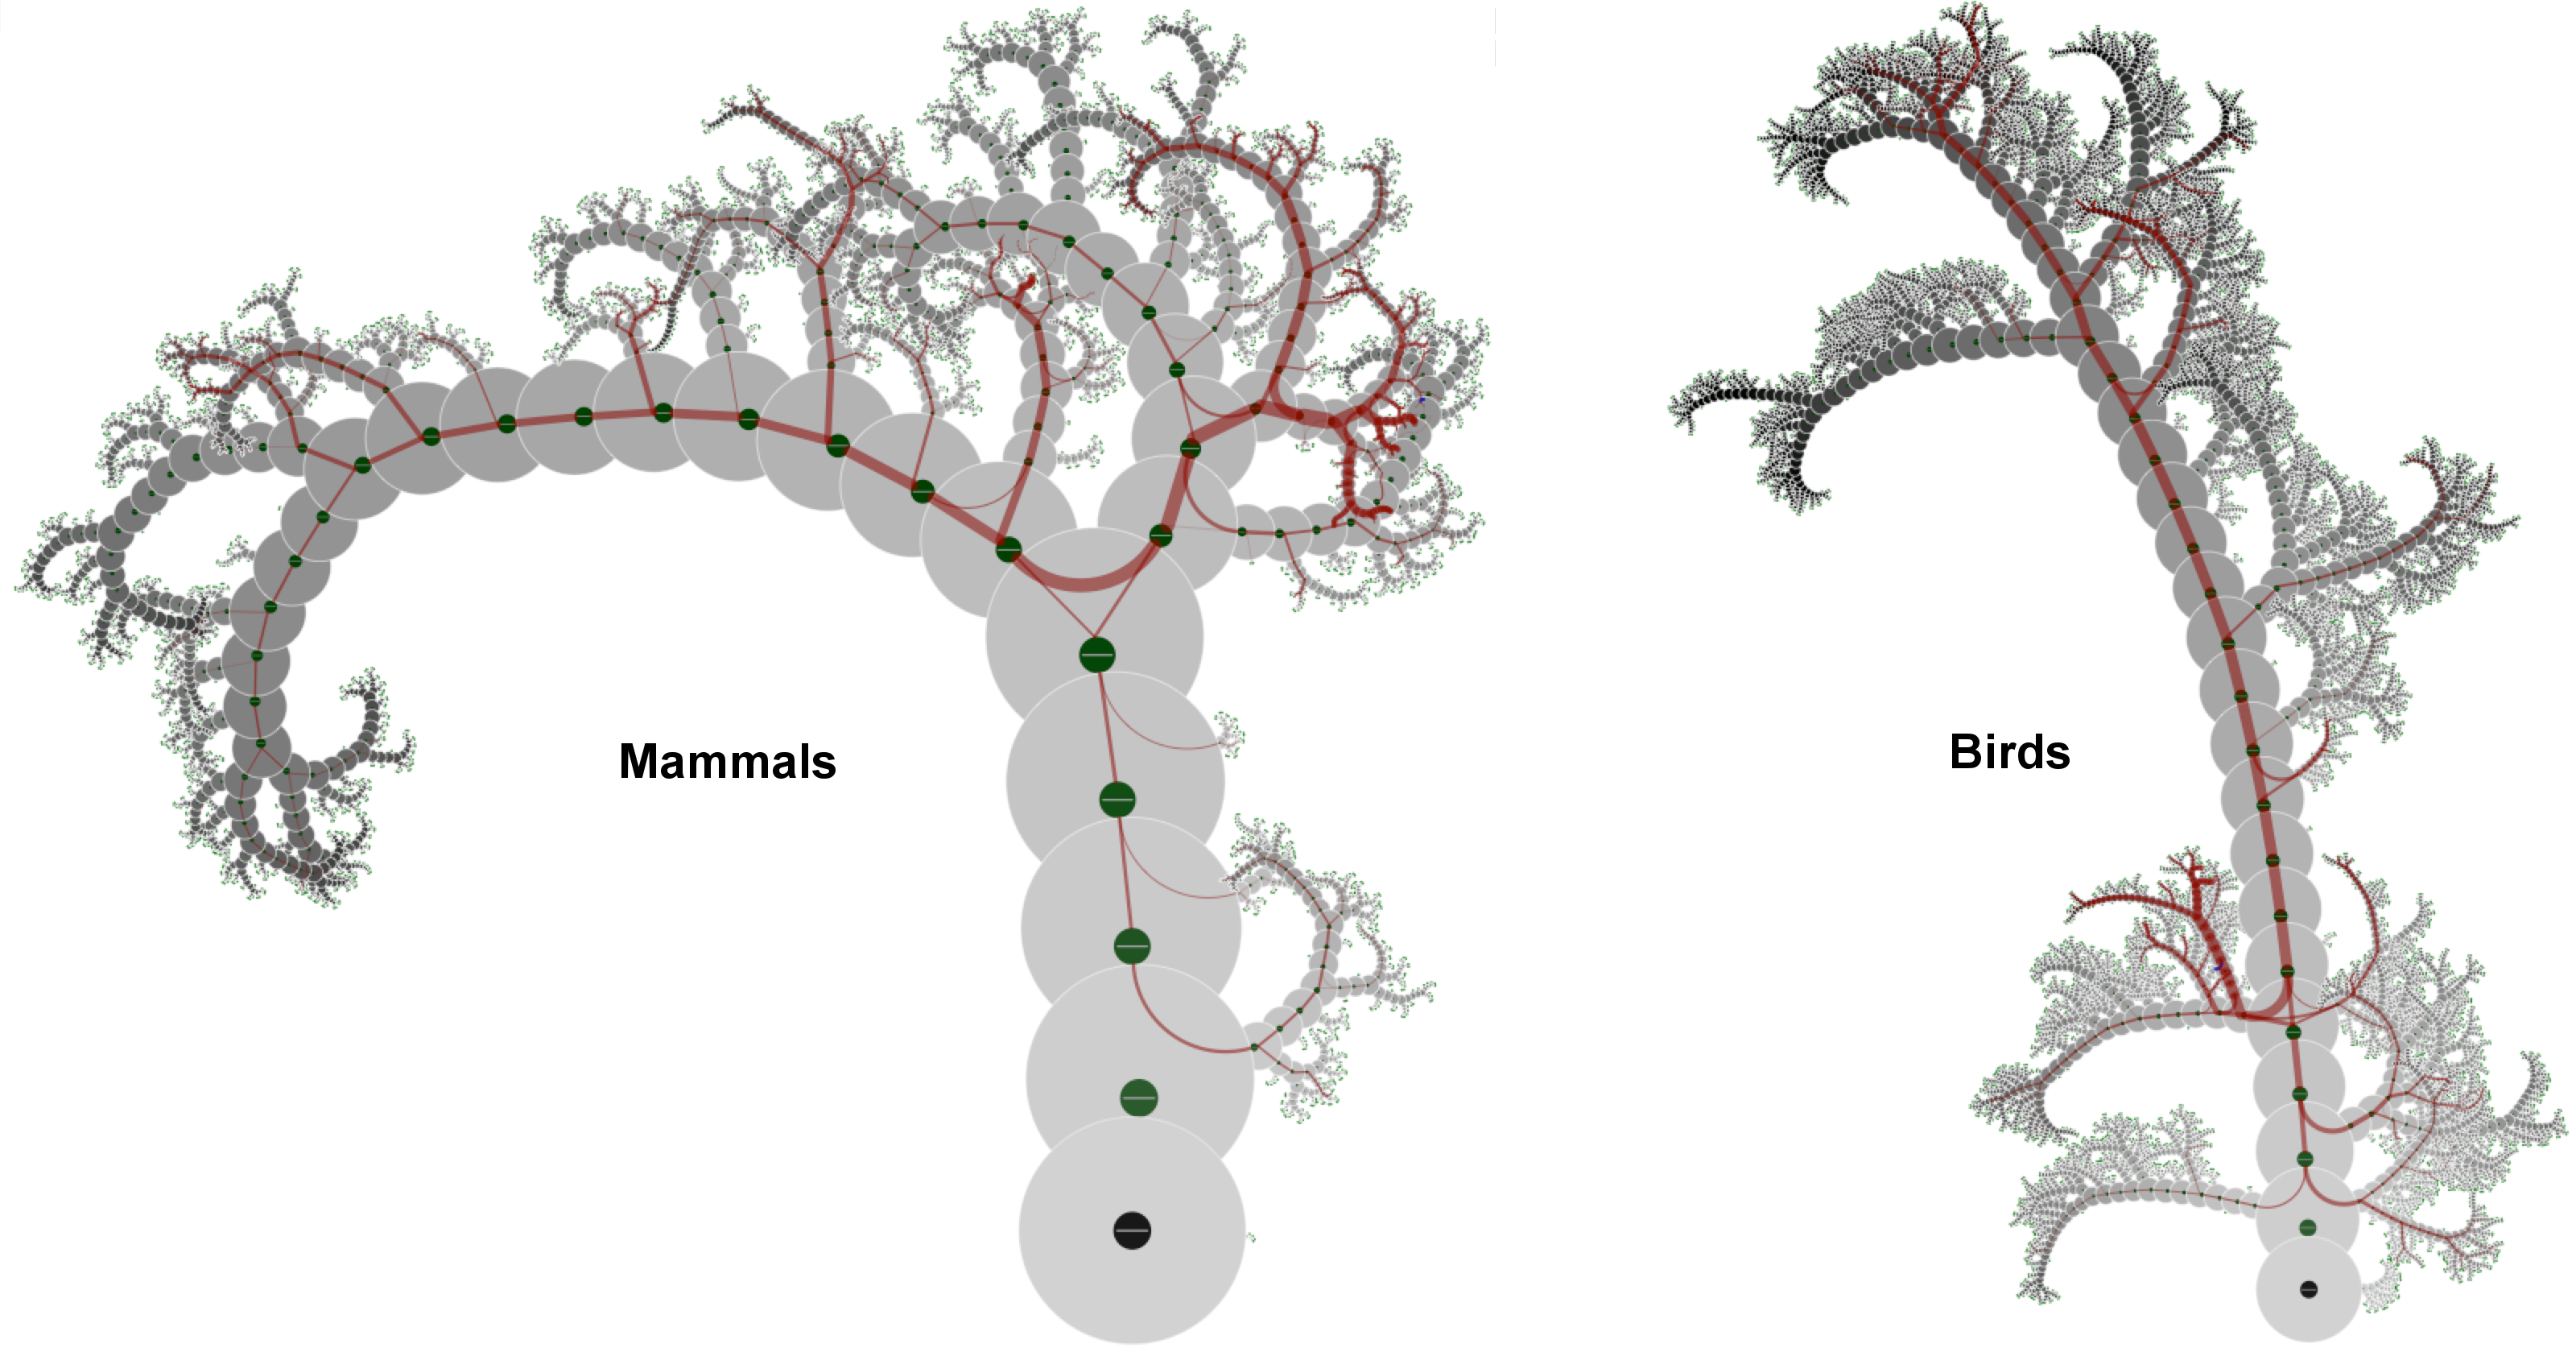
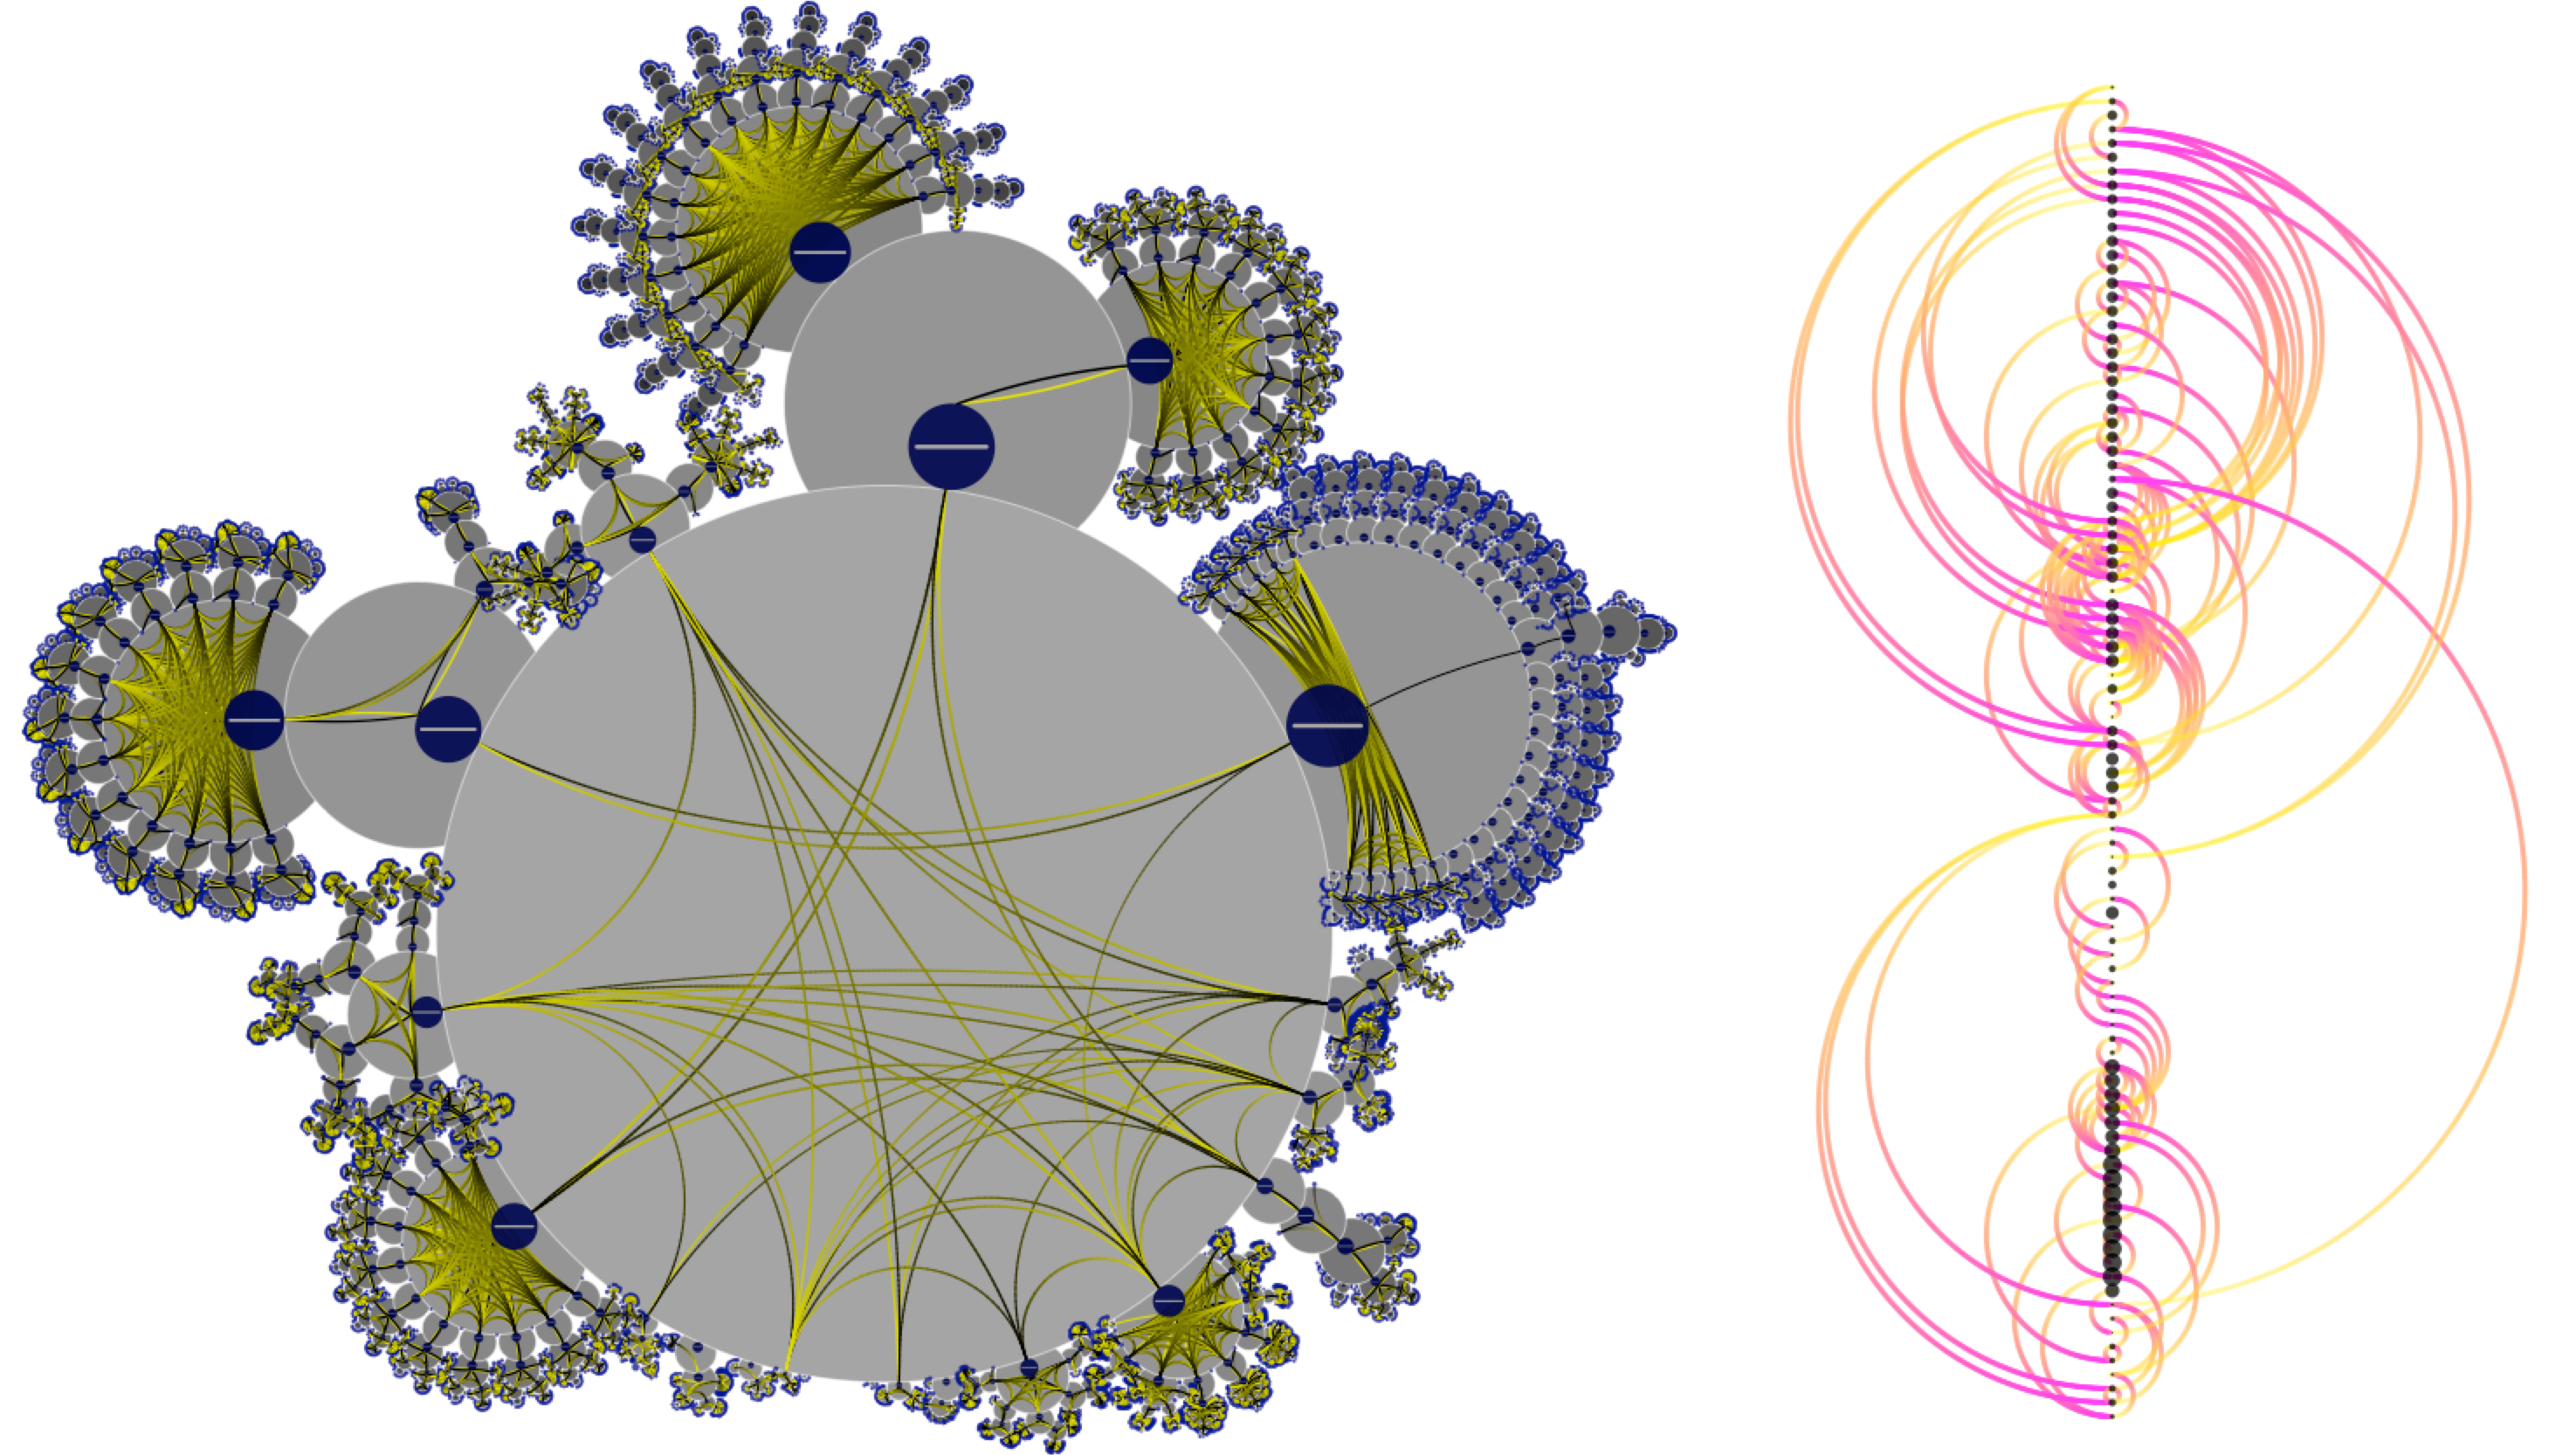
Visualizing causal relationships of 20 popular diseases (left) from reactome and HIV life cycle (right): Gradient links indicate causalities between biochemical reactions.
Dynamic network visualization
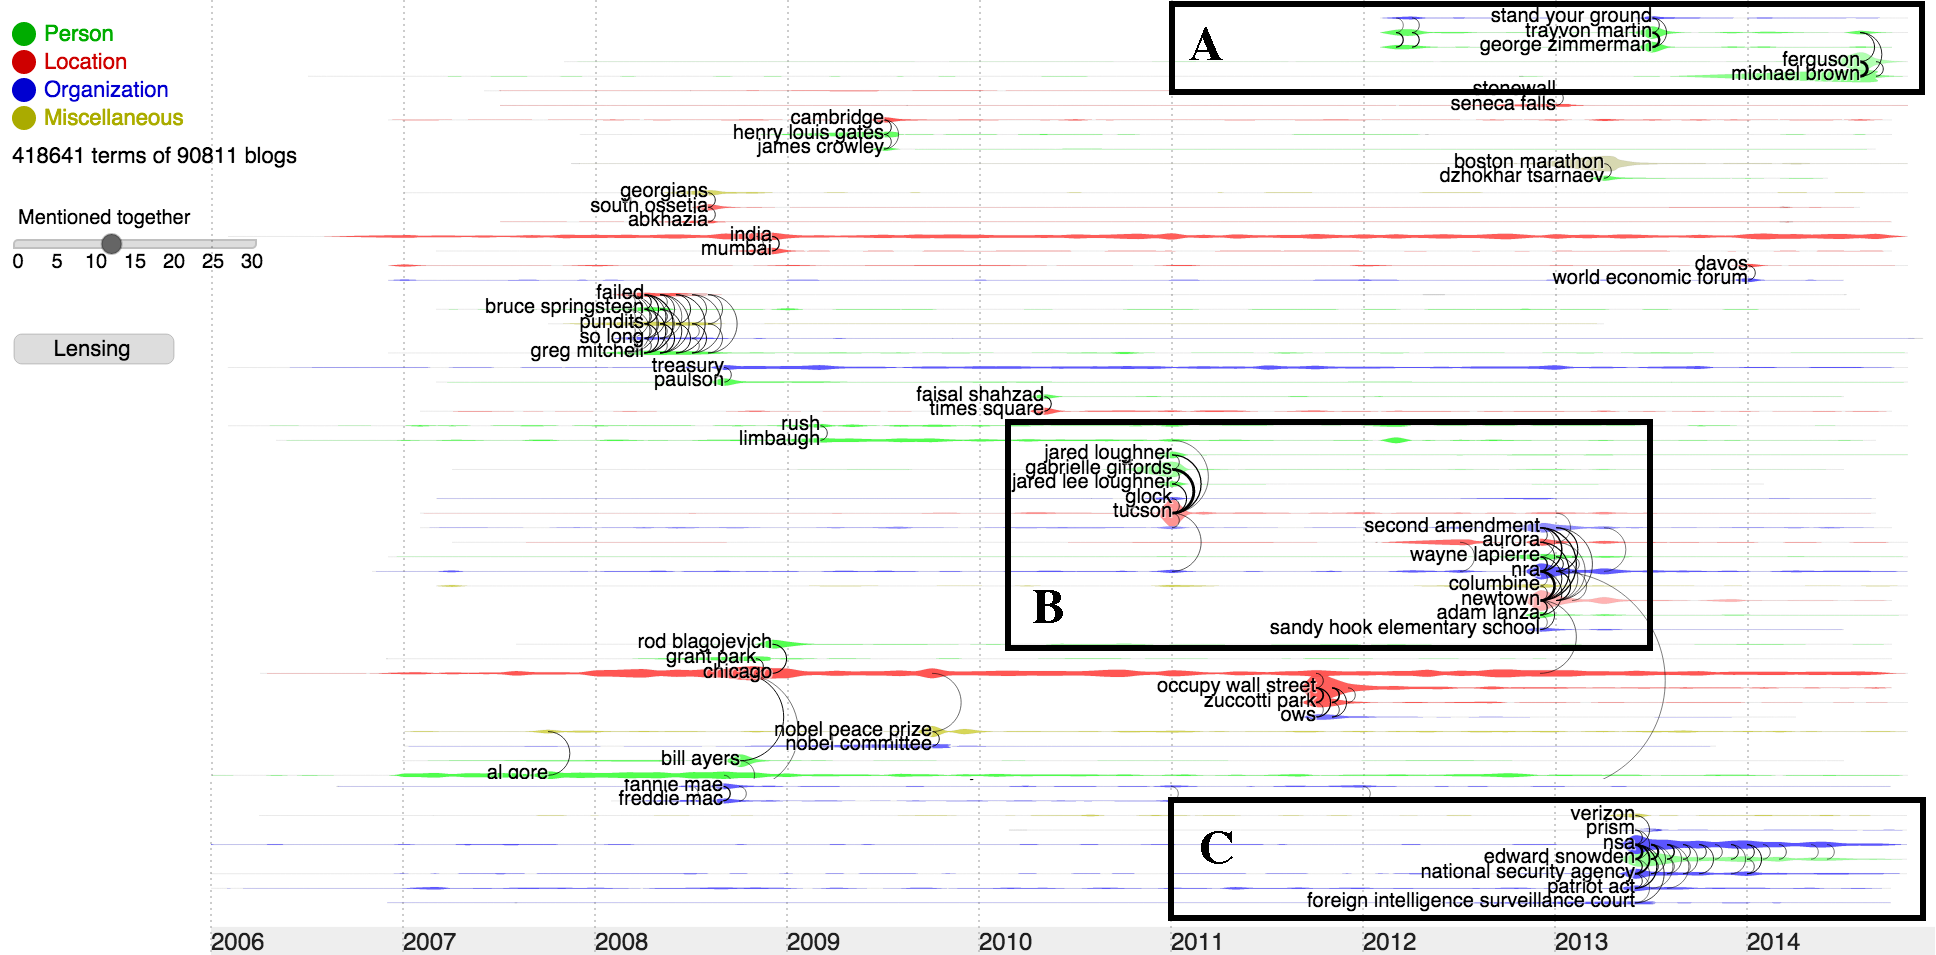
Major events from nearly 100,000 political blogs in last 10 years were automatically detected in our visualization: Links connect popular terms appeared in the same blogs.
Matrix visualization
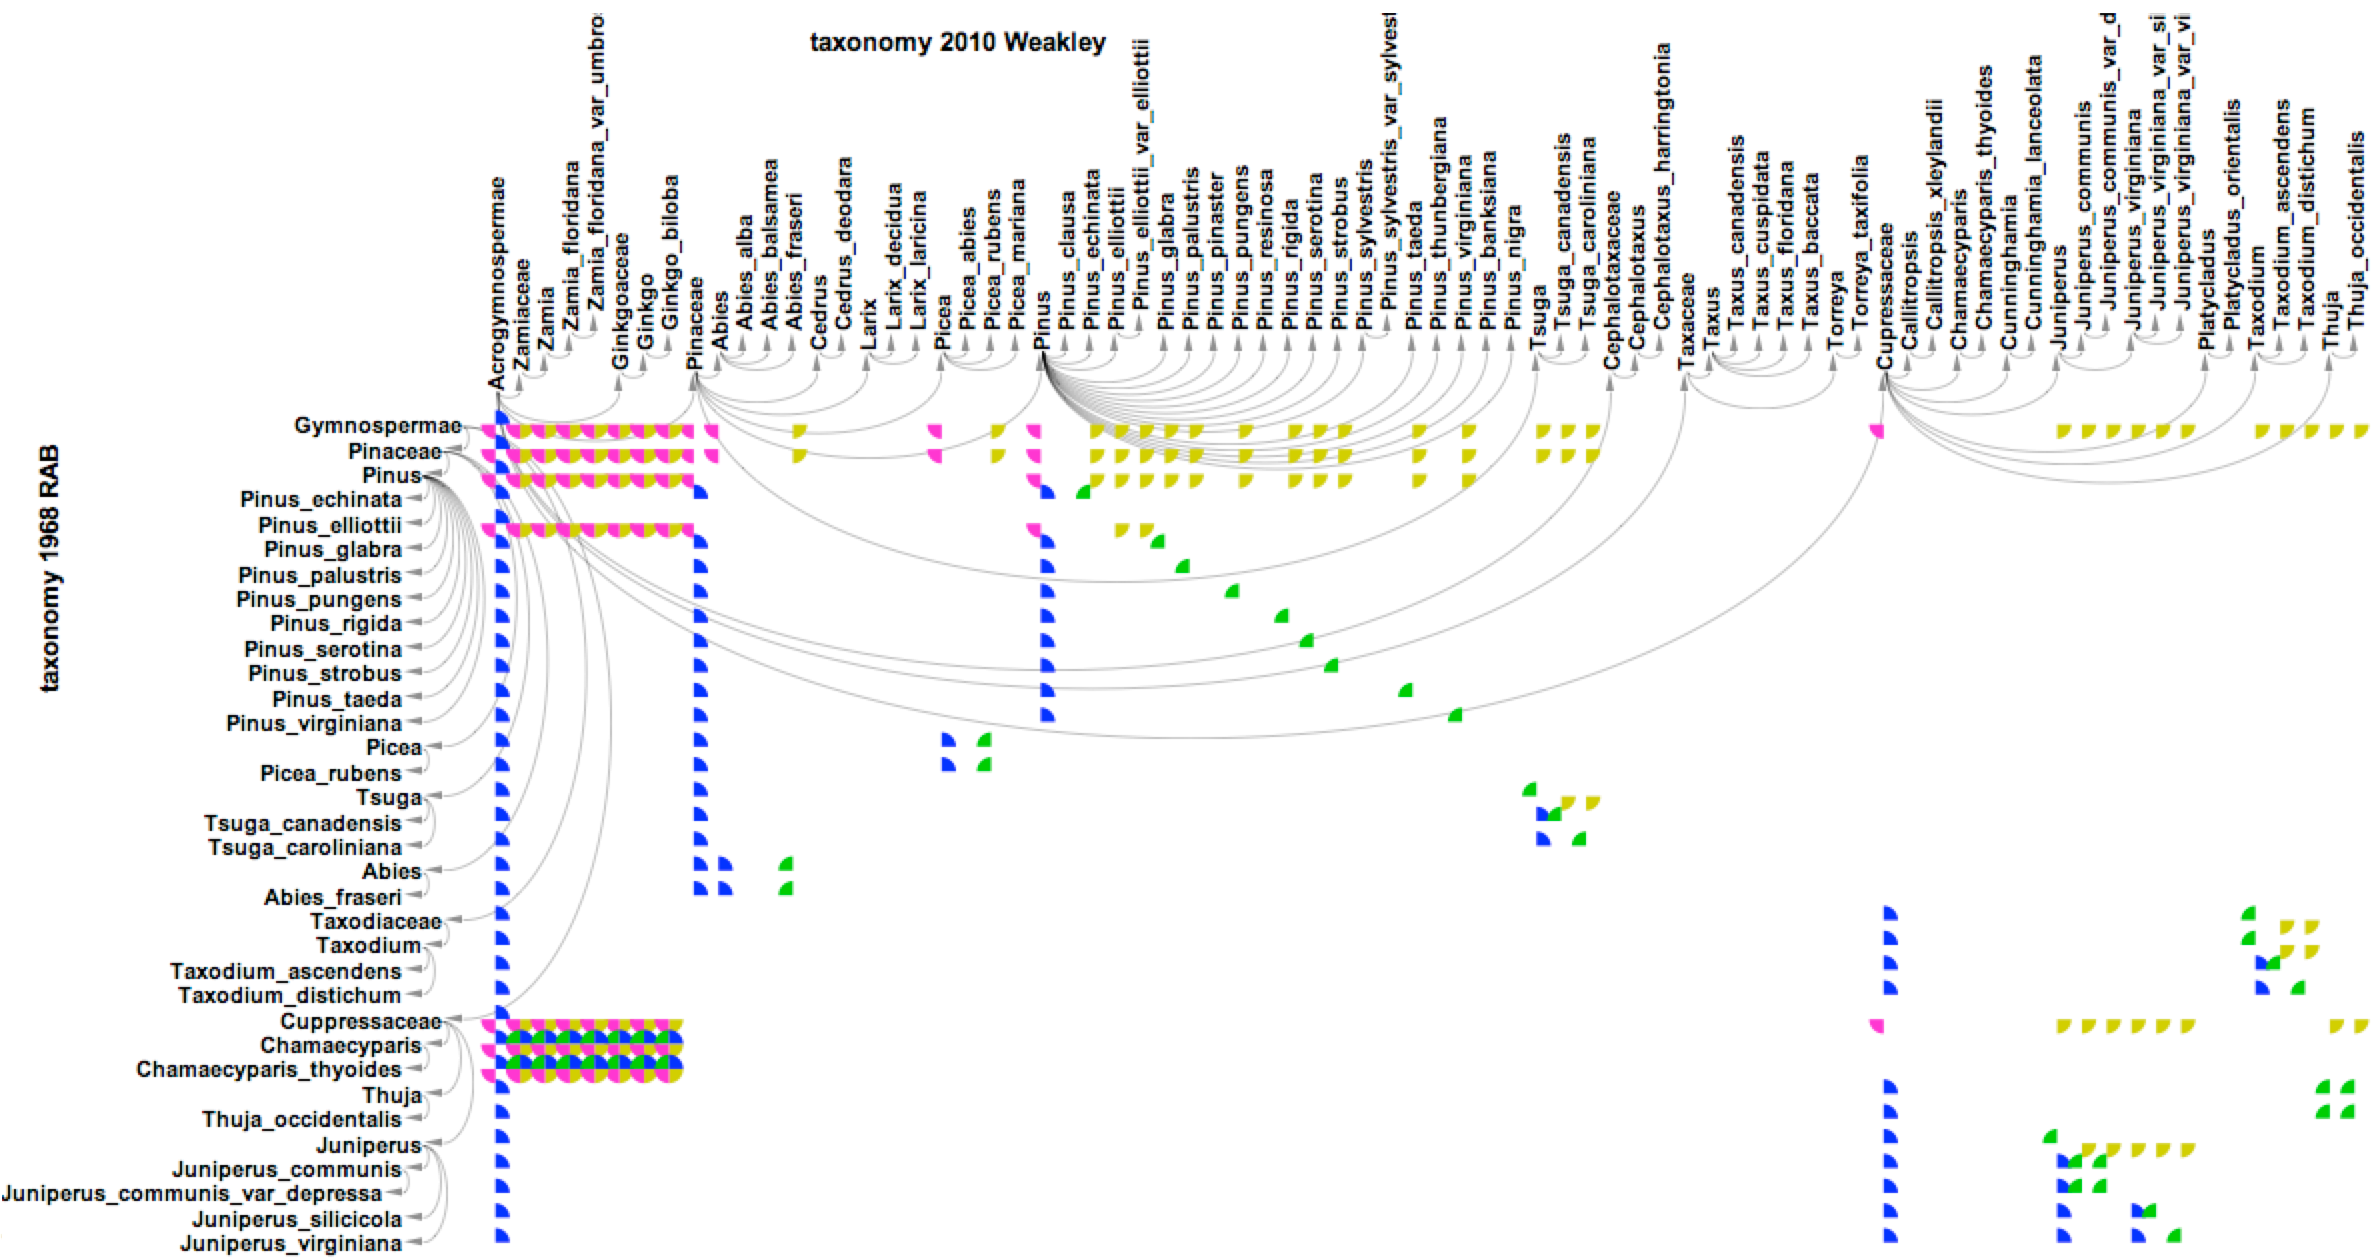
Visualizing the alignment of taxonomic classifications: Gymnospermae sec. Weakley (2010) vs. RAB (1968)
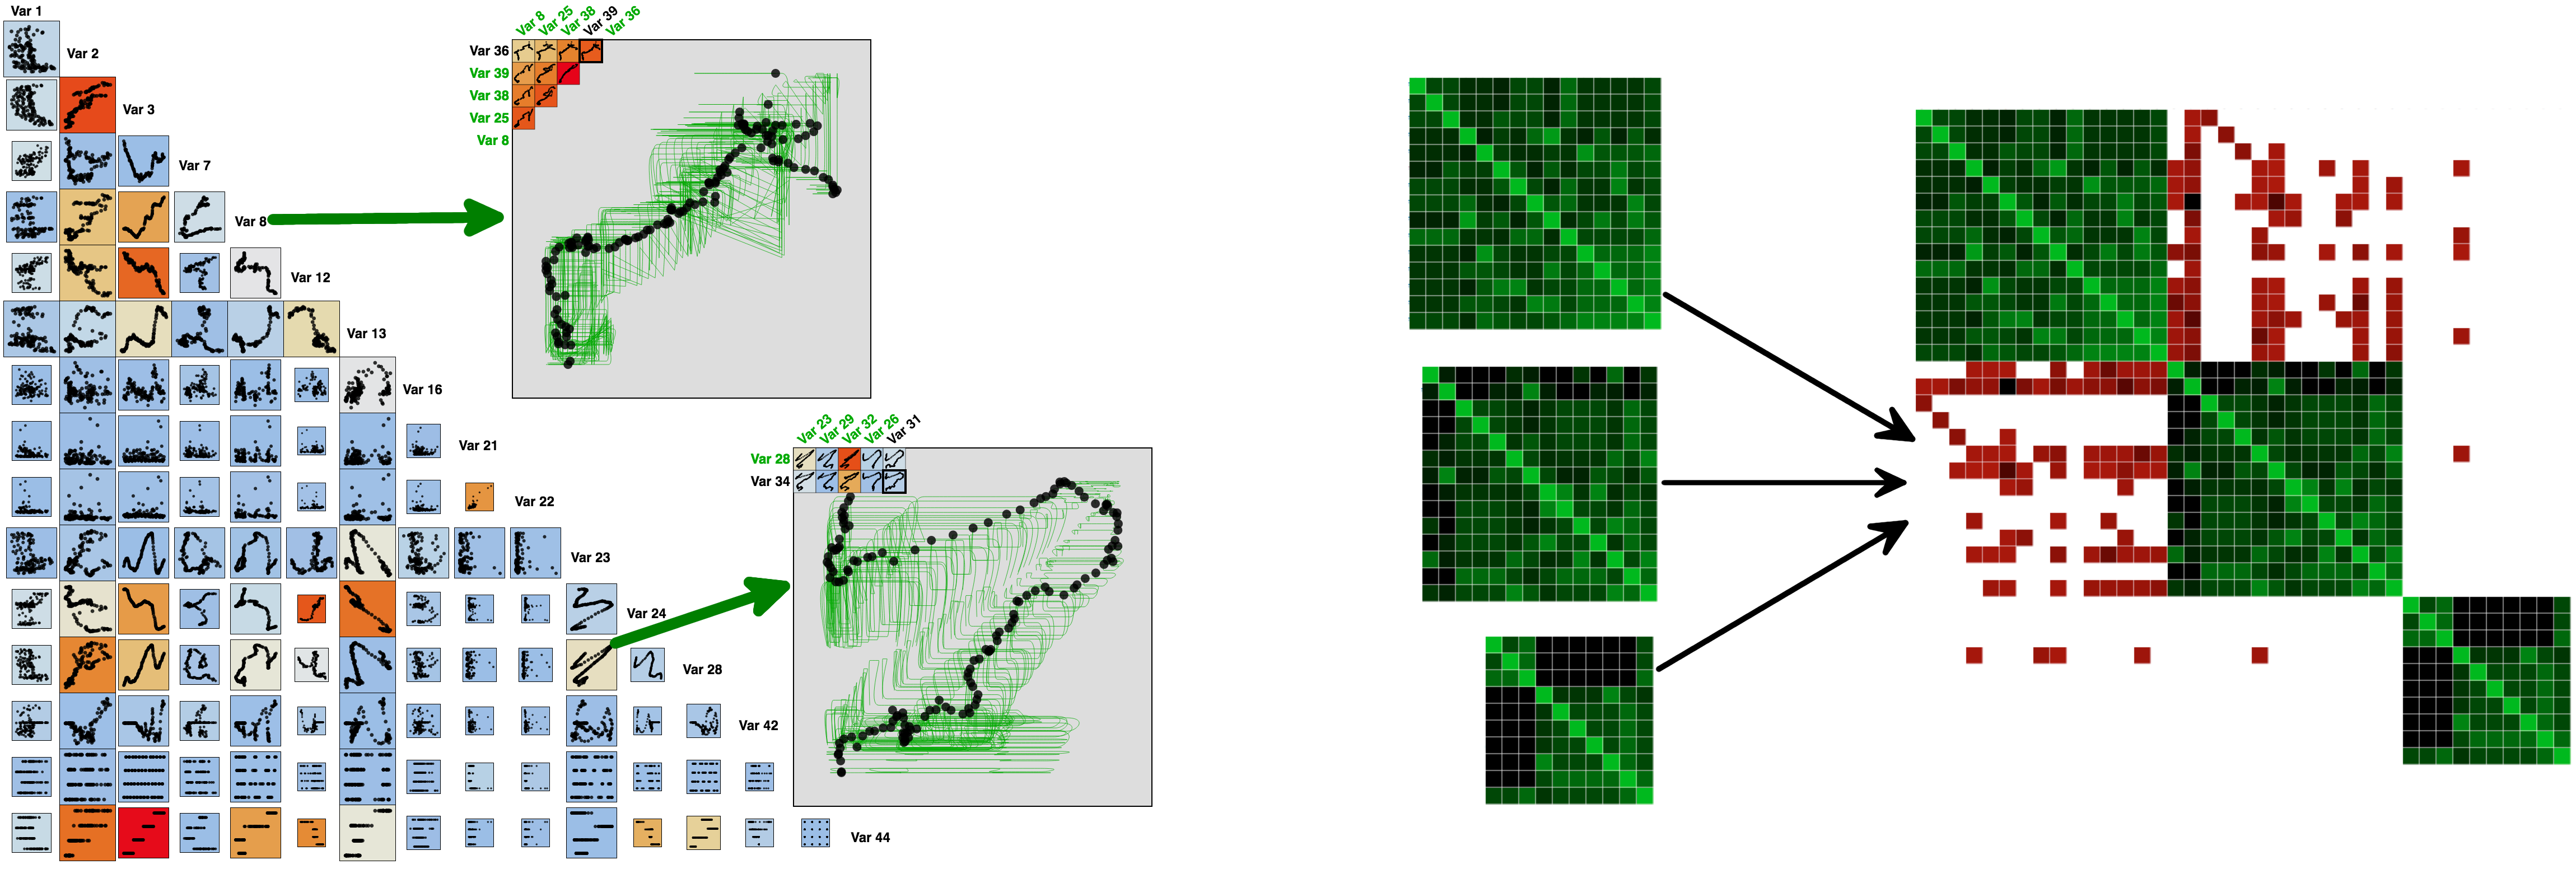
High-dimensional data are represented by a small subset of variables in the US unemployment rates (left) from BLS and in the Asteraceae taxonomy (right) of 2,048 characters.
Data visualization for soil science
Collaboration with Dr. David Weindorf and Wenxuan Guo at Texas Tech university
PXRF data is collected by


Next step
1) National Science Foundation I-Corps
2) Industrial collaboration: Next generation of the Vanta software?
Questions?
Email: Tommy.Dang@ttu.edu