ScagnosticsJS
ScagnosticsJS API Reference
There are 2D, 3D, and nD versions of the ScagnosticsJS library correspondingly.
The paper: ScagnosticsJS: Visual Features for the Web
References:
@inproceedings {s.20201022,
booktitle = {Eurographics 2020 - Short Papers},
editor = {Wilkie, Alexander and Banterle, Francesco},
title = {ScagnosticsJS: Extended Scatterplot Visual Features for the Web},
author = {Pham, Vung and Dang, Tommy},
year = {2020},
publisher = {The Eurographics Association},
ISSN = {1017-4656},
ISBN = {978-3-03868-101-4},
DOI = {10.2312/egs.20201022}
}
The presentation at The Eurographics 2020 conference:
Scagnostics playgrounds (online demos)
You can use these playground pages to explore the underlying scagnostics calculation processes and the visualizations of their intermediate results. They contain exemplar scatterplots for each of the 9 scagnostics (outlying, skewed, clumpy, sparse, striated, convex, skinny, stringy, and monotonic) features for you to explore:
2D: https://idatavisualizationlab.github.io/ScagnosticsJS/scagnostics
3D: https://idatavisualizationlab.github.io/ScagnosticsJS/scagnostics3d
nD: https://idatavisualizationlab.github.io/ScagnosticsJS/scagnosticsnd
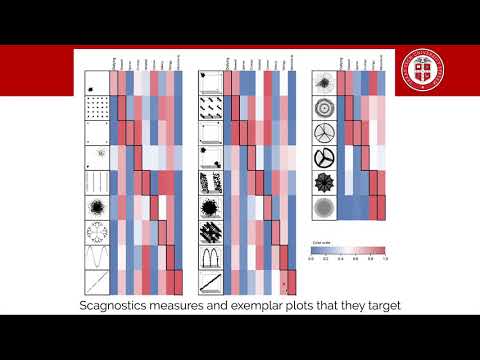
Scagnostics measures and the exemplar plots they target
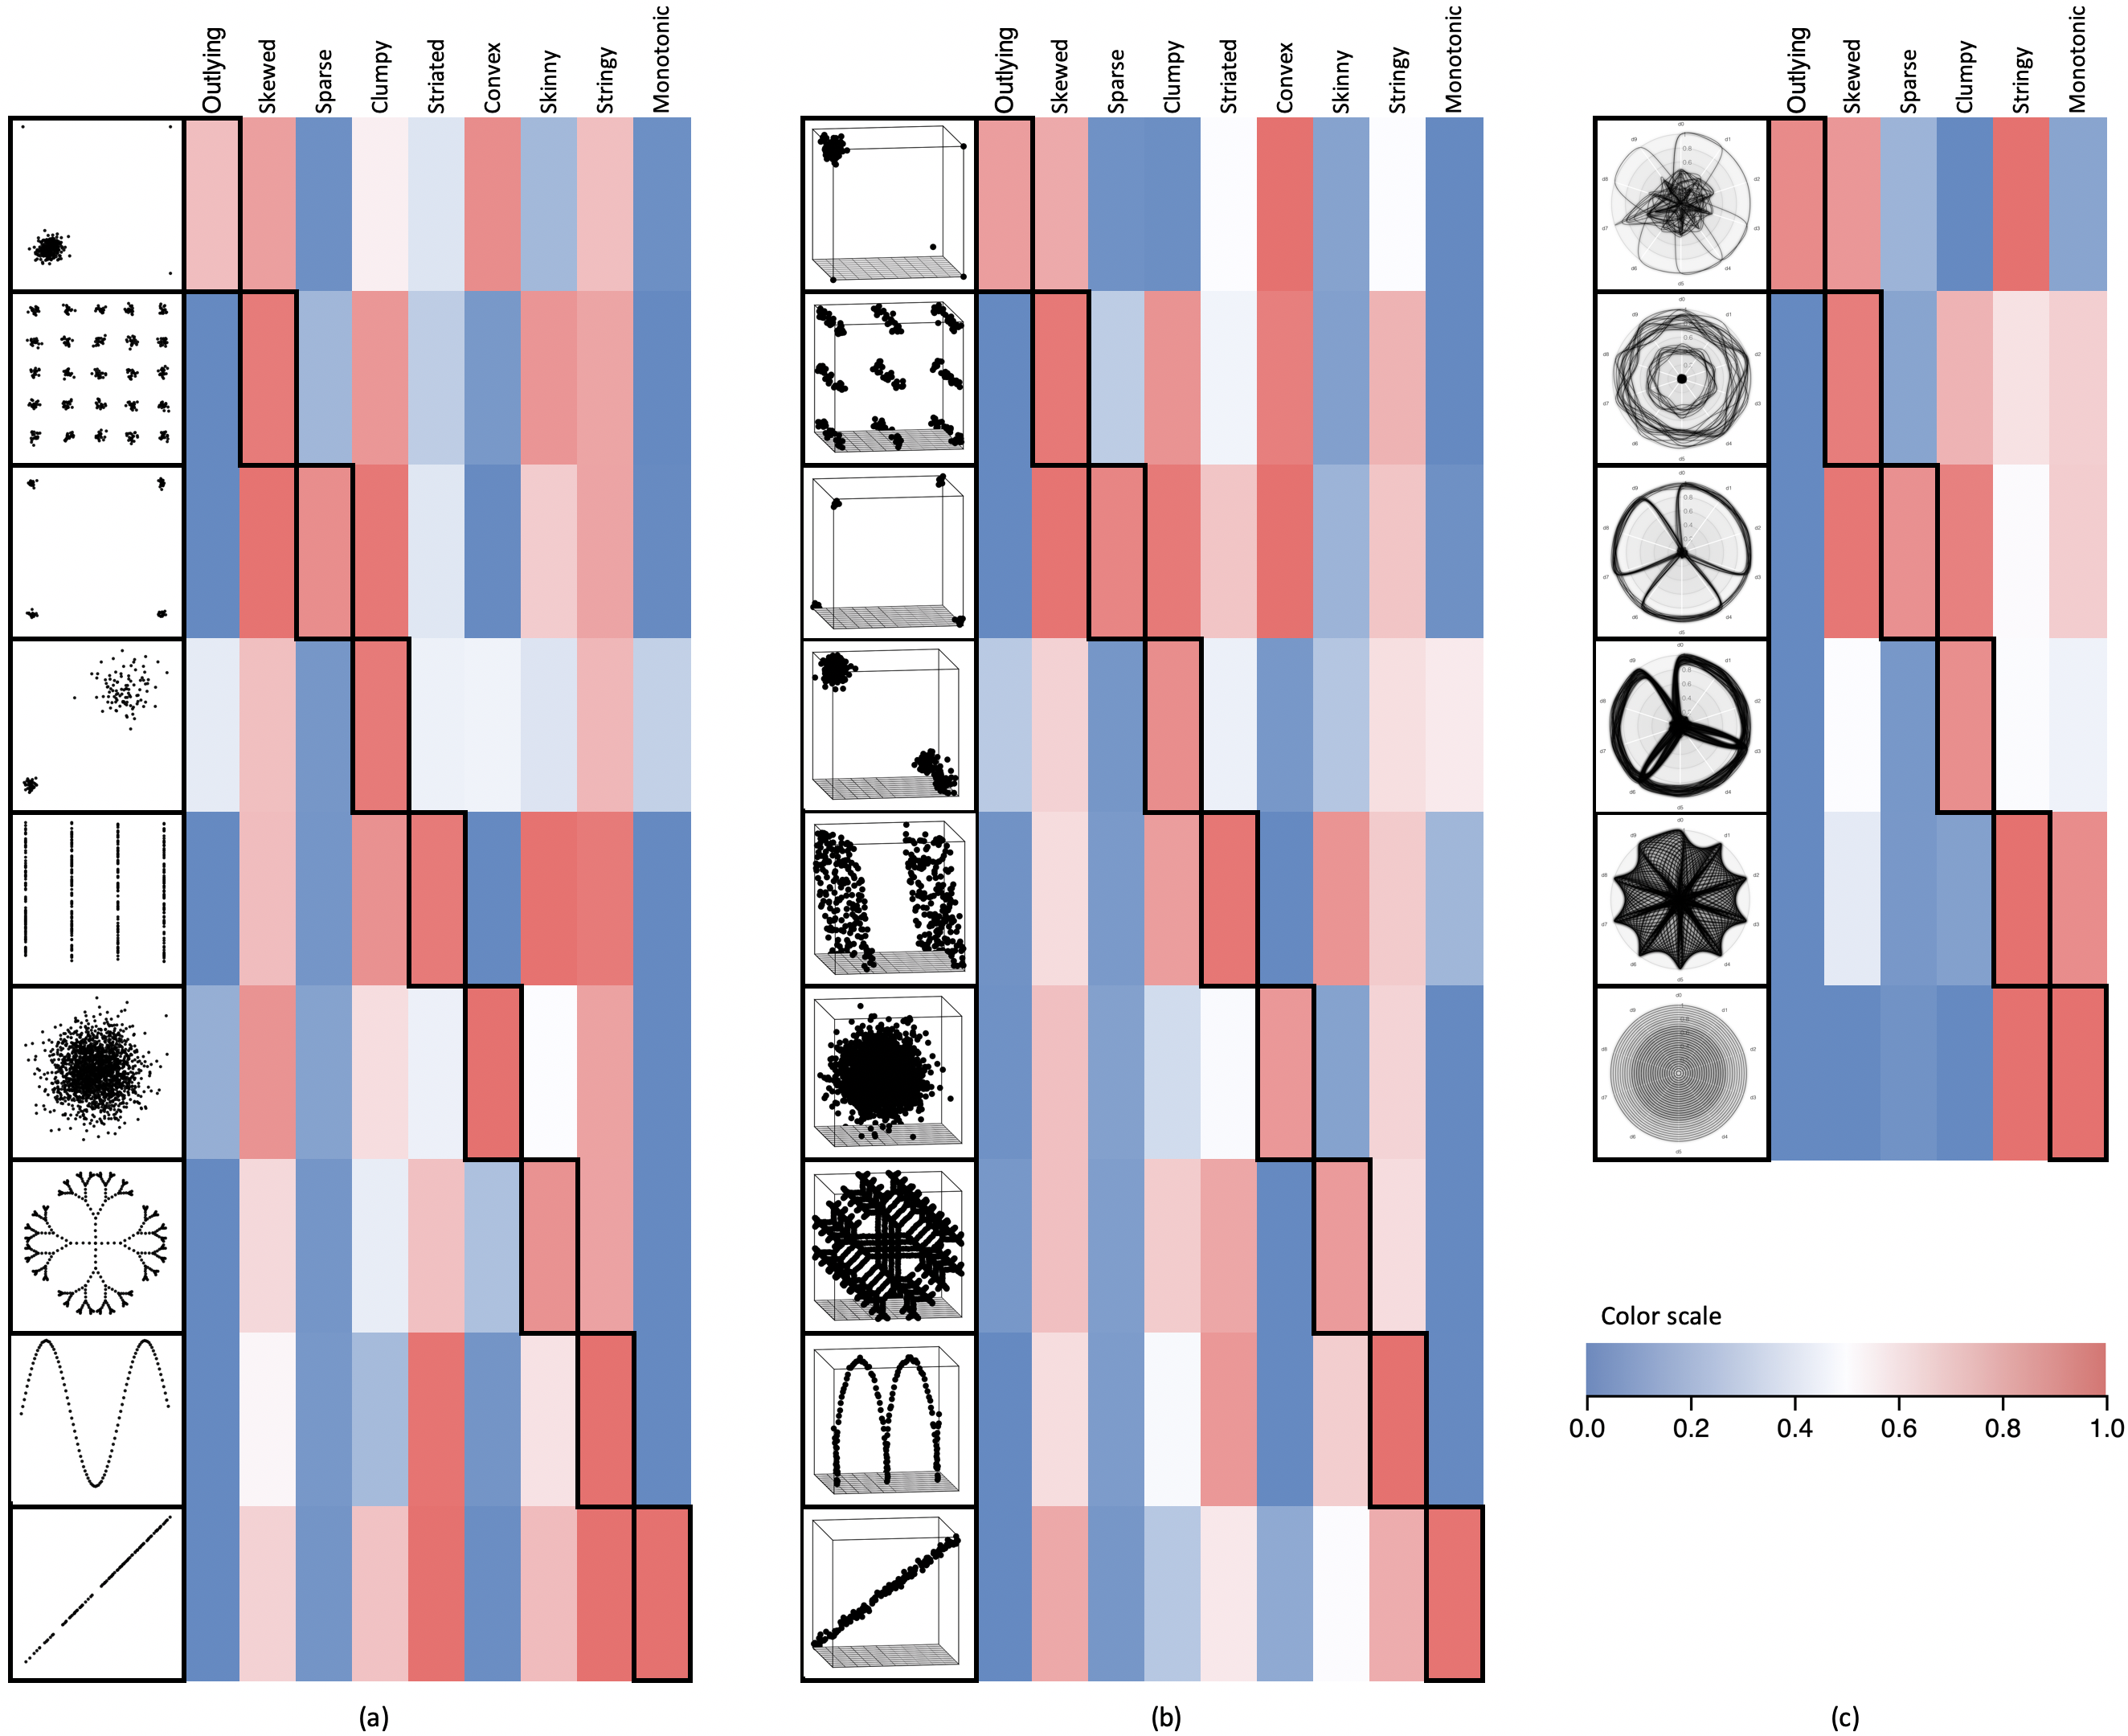 Figure 1: Scagnostics measures and exemplar plots that they target for 2D (a), 3D (b), and nD (c).
2D Version
Installation
Download
You can download scagnostics.js from here
CDN
You can add scagnostics.js to your web page using this code snippet:
<script type="text/javascript" src="https://idatavisualizationlab.github.io/ScagnosticsJS/scagnostics/build/js/scagnostics.min.js"></script>
Creating new scagnostics object
You will need to pass an array of 2D scatter plot points as [[x1, y1], [x2, y2], [x3, y3], [x4, y4],...[xn, yn]]. If you would like to pass some data (say ids of the points) then you may pass them as data attribute of the point. This data field will then be passed into the result after normalization or binning, so you could use this to get back the original point.
You may use default scagnostics options or you can optionally pass an options object with one or combination of the following fields
binType: as'leader'(default) or'hexagon'to use leader binning or hexagon binning correspondingly.startBinGridSize: default is40, an integer to start the binning process with (it starts with 40x40 bins in this case).isNormalized: default isfalse, if it istrue(in case the data is already normalized) then ScagnosticsJS will skip the normalizastion step to speed up the calculation time.isBinned: default isfalse, if it istrue(in case the data is already binned) then ScagnosticsJS will skip the binning step to speed up the calculation time.outlyingUpperBound: default isundefined, you may specify this outlying upper bound value to decide if a length of the Minimum Spanning Tree, built in the process of scagnostics calculation, is outlying or not.minBins: default is50, this is the minimum number of bins that you expect to have after binning process.maxBins: default is250, this is the maximum number of bins that you expect to have after binning process.
Sample code without options (default options)
    //Create an array of random 2D points
    let points = [];
    for (let i = 0; i < 100; i++) {
        let x = i* (3*Math.PI/100);
        let y = Math.sin(x);
        points.push([x+Math.random()/100, y+Math.random()/100]);
    }
    //Create scagnostics object
    let scag = new scagnostics(points);
Sample code with options
    //Create an array of 2D random points
    let points = [];
    for (let i = 0; i < 100; i++) {
        let x = i* (3*Math.PI/100);
        let y = Math.sin(x);
        points.push([x+Math.random()/100, y+Math.random()/100]);
    }
    //Set the scagnostics options
    const options = {
        binType: 'leader',
        startBinGridSize: 20,
        isNormalized: false,
        isBinned: false,
        outlyingUpperBound: undefined,
        minBins: 50,
        maxBins: 250
    };
    let scag = new scagnostics(points, options);
Normalized points
scag.normalizedPointsreturns an array of 2D points after normalized to the range[0, 1]. Each point will contain adatafield that passed from the original point (if you assigned one), so you could use to get back the information from the original point.Binning information
scag.binswill return all thebins. Abincontains an array of points belonging to that bin andx,yattributes for the location (center) of the bin.
Outlying score
scag.outlyingScorereturns the scagnostics outlying score.Skewed score
scag.skewedScorereturns the scagnostics skewed score.Clumpy score
scag.clumpyScorereturns the scagnostics clumpy score.Sparse score
scag.sparseScorereturns the scagnostics sparse score.Striated score
scag.striatedScorereturns the scagnostics striated score.Convex score
scag.convexScorereturns the scagnostics convex score.Skinny score
scag.skinnyScorereturns the scagnostics stringy score.Stringy score
scag.stringyScorereturns the scagnostics stringy score.Monotonic score
scag.monotonicScorereturns the scagnostics monotonic score.
3D Version
Installation
Download
You can download scagnostics3d.js from here
CDN
You can add scagnostics3d.js to your web page using this code snippet:
<script type="text/javascript" src="https://idatavisualizationlab.github.io/ScagnosticsJS/scagnostics3d/build/js/scagnostics3d.min.js"></script>
Creating new scagnostics3d object
You will need to pass an array of 3D scatter plot points as [[x1, y1, z1], [x2, y2, z2], [x3, y3, z3], [x4, y4, z4],...[xn, yn, zn]]. If you would like to pass some data (say ids of the points) then you may pass them as data attribute of the point. This data field will then be passed into the result after normalization or binning, so you could use this to get back the original point.
You may use default scagnostics options or you can optionally pass an options object with one or combination of the following fields
binType: as'leader'(default), currently only'leader'binning is supported.startBinGridSize: default is40, an integer to start the binning process with (it starts with 40x40x40 bins in this case).isNormalized: default isfalse, if it istrue(in case the data is already normalized) then ScagnosticsJS will skip the normalizastion step to speed up the calculation time.isBinned: default isfalse, if it istrue(in case the data is already binned) then ScagnosticsJS will skip the binning step to speed up the calculation time.outlyingUpperBound: default isundefined, you may specify this outlying upper bound value to decide if a length of the Minimum Spanning Tree, built in the process of scagnostics calculation, is outlying or not.minBins: default is30, this is the minimum number of bins that you expect to have after binning process.maxBins: default is200, this is the maximum number of bins that you expect to have after binning process.
Sample code without options (default options)
    //Create an array of random 3D points
    let noise = ()=> Math.random()/10;
        let points = [];
        for (let x = 0; x < 150; x++) {
            points.push([x + noise(), Math.sin(x * Math.PI / 20) + noise(), Math.cos(x * Math.PI / 20) + noise()])
        };
    //Create scagnostics object
    let scag = new scagnostics3d(points);
Sample code with options
    //Create an array of random 3D points
    let noise = ()=> Math.random()/10;
        let points = [];
        for (let x = 0; x < 150; x++) {
            points.push([x + noise(), Math.sin(x * Math.PI / 20) + noise(), Math.cos(x * Math.PI / 20) + noise()])
        };
    //Set the scagnostics options
    const options = {
        binType: 'leader',
        startBinGridSize: 20,
        isNormalized: false,
        isBinned: false,
        outlyingUpperBound: undefined,
        minBins: 30,
        maxBins: 200
    };
    let scag = new scagnostics3d(points, options);
Normalized points
scag.normalizedPointsreturns an array of 3d points after normalized to the range[0, 1]. Each point will contain adatafield that passed from the original point (if you assigned one), so you could use to get back the information from the original point.Binning information
scag.binswill return all thebins. Abincontains an array of points belonging to that bin andx,y,zattributes for the location (center) of the bin.
Outlying score
scag.outlyingScorereturns the scagnostics outlying score.Skewed score
scag.skewedScorereturns the scagnostics skewed score.Clumpy score
scag.clumpyScorereturns the scagnostics clumpy score.Sparse score
scag.sparseScorereturns the scagnostics sparse score.Striated score
scag.striatedScorereturns the scagnostics striated score.Convex score
scag.convexScorereturns the scagnostics convex score.Skinny score
scag.skinnyScorereturns the scagnostics stringy score.Stringy score
scag.stringyScorereturns the scagnostics stringy score.Monotonic score
scag.monotonicScorereturns the scagnostics monotonic score.
nD Version
Installation
Download
You can download scagnosticsnd.js from here
CDN
You can add scagnosticsnd.js to your web page using this code snippet:
<script type="text/javascript" src="https://idatavisualizationlab.github.io/ScagnosticsJS/scagnosticsnd/build/js/scagnosticsnd.min.js"></script>
Creating new scagnosticsnd object
You will need to pass an array of nD scatter plot points as [[x1, y1, z1, ...], [x2, y2, z2, ...], [x3, y3, z3, ...], [x4, y4, z4, ...], ... [xn, yn, zn, ...]]. If you would like to pass some data (say ids of the points) then you may pass them as data attribute of the point. This data field will then be passed into the result after normalization or binning, so you could use this to get back the original point.
You may use default scagnostics options or you can optionally pass an options object with one or combination of the following fields
binType: as'leader'(default), currently onlyleaderbinning is supported.startBinGridSize: default is20, an integer to start the binning process with (it starts with 20x20x20… bins in this case). For high number of dimensions, the number of bins to start with increases exponentially, so consider reducing this number for better performance.isNormalized: default isfalse, if it istrue(in case the data is already normalized) then ScagnosticsJS will skip the normalizastion step to speed up the calculation time.isBinned: default isfalse, if it istrue(in case the data is already binned) then ScagnosticsJS will skip the binning step to speed up the calculation time.outlyingUpperBound: default isundefined, you may specify this outlying upper bound value to decide if a length of the Minimum Spanning Tree, built in the process of scagnostics calculation, is outlying or not.minBins: default is30, this is the minimum number of bins that you expect to have after binning process.maxBins: default is200, this is the maximum number of bins that you expect to have after binning process.outlyingCoefficient: default is 3, this is used to calculate the outlying threshold on the MST lengths using this formula:upperBound = 75th quantile + outlyingCoefficient*IQR. We provide this option since in high dimensional data the default formulaupperBound = 75th quantile + 1.5*IQRmay not work in detecting outliers.incrementA: default is 2, in high dimension data, number of bins will change dramatically if we change the bin grid size, therefore, we can use the formulabinSize = incrementA*binSize + incrementBto control the increment of thebinSize.incrementB: default is 0, explained inincrementAsection.decrementA: default is 1/2, in high dimension data, number of bins will change dramatically if we change the bin grid size, therefore, we can use the formulabinSize = decrementA*binSize + decrementBto control the decrement of thebinSize.decrementB: default is 0, explained inincrementAsection.distanceWeights: default is 1 for every dimension. In high dimensional data, we may need the option to control the weights of each dimension in the contribution to the distance calculation among points. In this case we can specify this as an array, a value in range [0, 1] represents the weight of the corresponding dimension in distance calculation. E.g.,[0.5, 1, 1, 1, 1, 1, 0.5]means that there are 7 dimensions and the first and last have the weights of 0.5 in calculating distances.
Sample code without options (default options)
    /***********RANDOM DATA*******************/
    let random = Math.random,
        points = [];
    //100 data points
    for (let i = 0; i < 100; i++) {
        //each point of 10 dimensions
        let point = [];
        for (let j = 0; j < 10; j++) {
            point.push(random());
        }
        points.push(point);
    }
    //Create scagnostics object
    let scag = new scagnosticsnd(points);
Sample code with options
    /***********RANDOM DATA*******************/
    let random = Math.random,
        points = [];
    //100 data points
    for (let i = 0; i < 100; i++) {
        //each point of 10 dimensions
        let point = [];
        for (let j = 0; j < 10; j++) {
            point.push(random());
        }
        points.push(point);
    }
    //Create options
    let options = {
        startBinGridSize: 30,
        minBins: 30,
        maxBins: 100,
        outlyingCoefficient: 0.5,
        incrementA: 1,
        incrementB: 5,
        decrementA: 0.9,
        decrementB: 0,
        distanceWeights: [0.5, 0.5, 0.5, 1, 1, 1, 1, 1, 1, 0.5]
    };
    let scag = new scagnosticsnd(points, options);
Normalized points
scag.normalizedPointsreturns an array of nD points after normalized to the range[0, 1]. Each point will contain adatafield that passed from the original point (if you assigned one), so you could use to get back the information from the original point.Binning information
scag.binswill return all thebins. Abincontains an array of points belonging to that bin andx,y,z, … attributes for the location (center) of the bin.Outlying score
scag.outlyingScorereturns the scagnostics outlying score.Skewed score
scag.skewedScorereturns the scagnostics skewed score.Clumpy score
scag.clumpyScorereturns the scagnostics clumpy score.Sparse score
scag.sparseScorereturns the scagnostics sparse score.Striated score
scag.striatedScorereturnsundefinedin this current version.Convex score
scag.convexScorereturnsundefinedin this current version.Skinny score
scag.skinnyScorereturnsundefinedin this current version.Stringy score
scag.stringyScorereturns the scagnostics stringy score.Monotonic score
scag.monotonicScorereturns the scagnostics monotonic score.