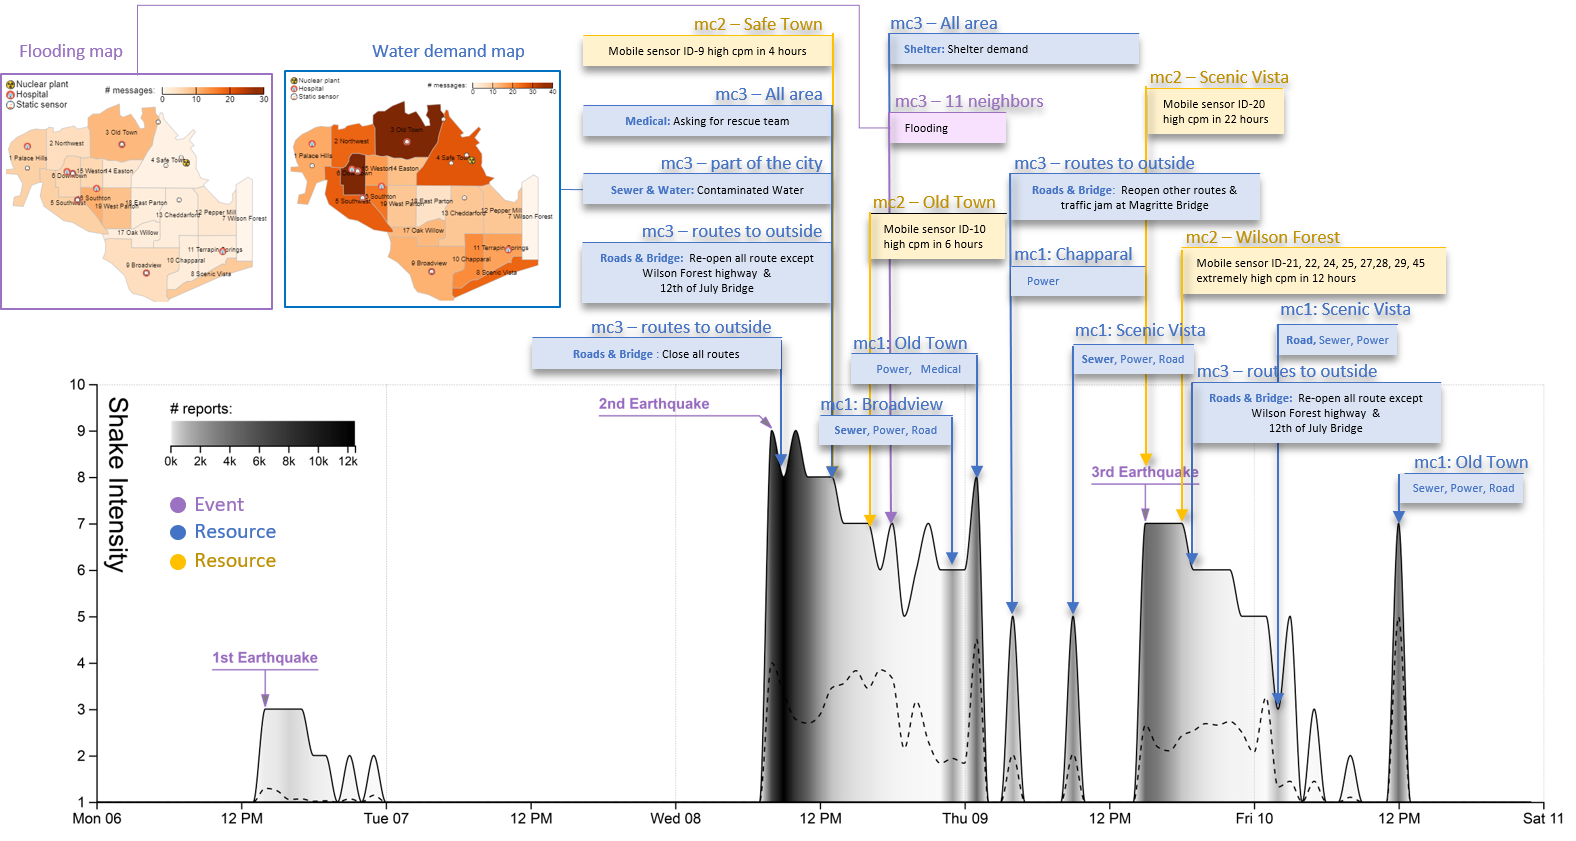
The master timeline is shown in figure 1 display all event collected from the multi mini-challenge:
The 1st earthquake occurs about 2 pm April 06 has low shake intensity and less attention from the citizen.
The 2nd earthquake happens about 8:00 am on April 08 and have every high shake intensity. Just one hour after the hit, all route has been closed. Due to the earthquake, the Nuclear plant has a sign of leak radian.
Although the static sensor around nuclear plant does not have high CPM (radiation value), a mobile car ID 9 drives to near static sensor 15 and sent CPM value up to 500 CPM during 4 hours until that car leave Safe Town.
At the same time, the message from HealthDept about contaminated water and broken sewer pile has been release. In detail, five neighborhoods Old Town, Safe Town, Scenic Vista, Broadview, Chapparal, and Easton are related to this event. Moreover, the demand and concern of water is significantly increased at this time.
Meanwhile, all route reopen except Wilson forest high-way and 12th July bridge (a bridge connect from Safe Town to outside of the city). The traffic jam makes the mobile sensor ID 10 stand in the Jade bridge for hours, even after Jade bridge reopened. At 4:00 pm April 06 ( 8 hours after the second earthquake).
The mobile sensor ID 10 start to get high CPM up to 1500 CPM for over 6 hours later. Once again, the static sensor is not coincident with the mobile sensor. The static mobile ID 12 at the same location of mobile sensor ID 10 have minimal increment (from 16cmp to 27cpm), this can be a sight of the problem of the static sensor in general; the static senor may have the wrong measurement and always maintain in the safe radiation value.
Why mobile sensor ID 10 has the high CPM is unknown, however, according to media post from mini-challenge 3, this can be the result of broken piles (water out of the street) in Old Town and contaminated event.
10 hours after the second earthquake, the flood has been reported and push the shelter demand to the peak. Since here, discrete reports in mini-challenge 1 (this can cause by the power out problem, will be mention in question 2) from Broadview, Old Town and Chapparal.
The 3rd earthquake happens about 3:00 pm on April 09 and have lower shake intensity than the second once, however, this earthquake get the citizen the most attention. A lot of post describe shaking, quivering, quaking, etc received in this time. Meanwhile, the mobile sensor ID 20 in Scenic Vista start to get 188 CPM value during the next 22 hours.
After 3rd earthquake 3 hours, an extremely high radian event is occurs in wilson forest high way and cause the block rout in Wilson Forest highway and 12th of July Bridge. The traffic and sewer problem still not over come after April 10.
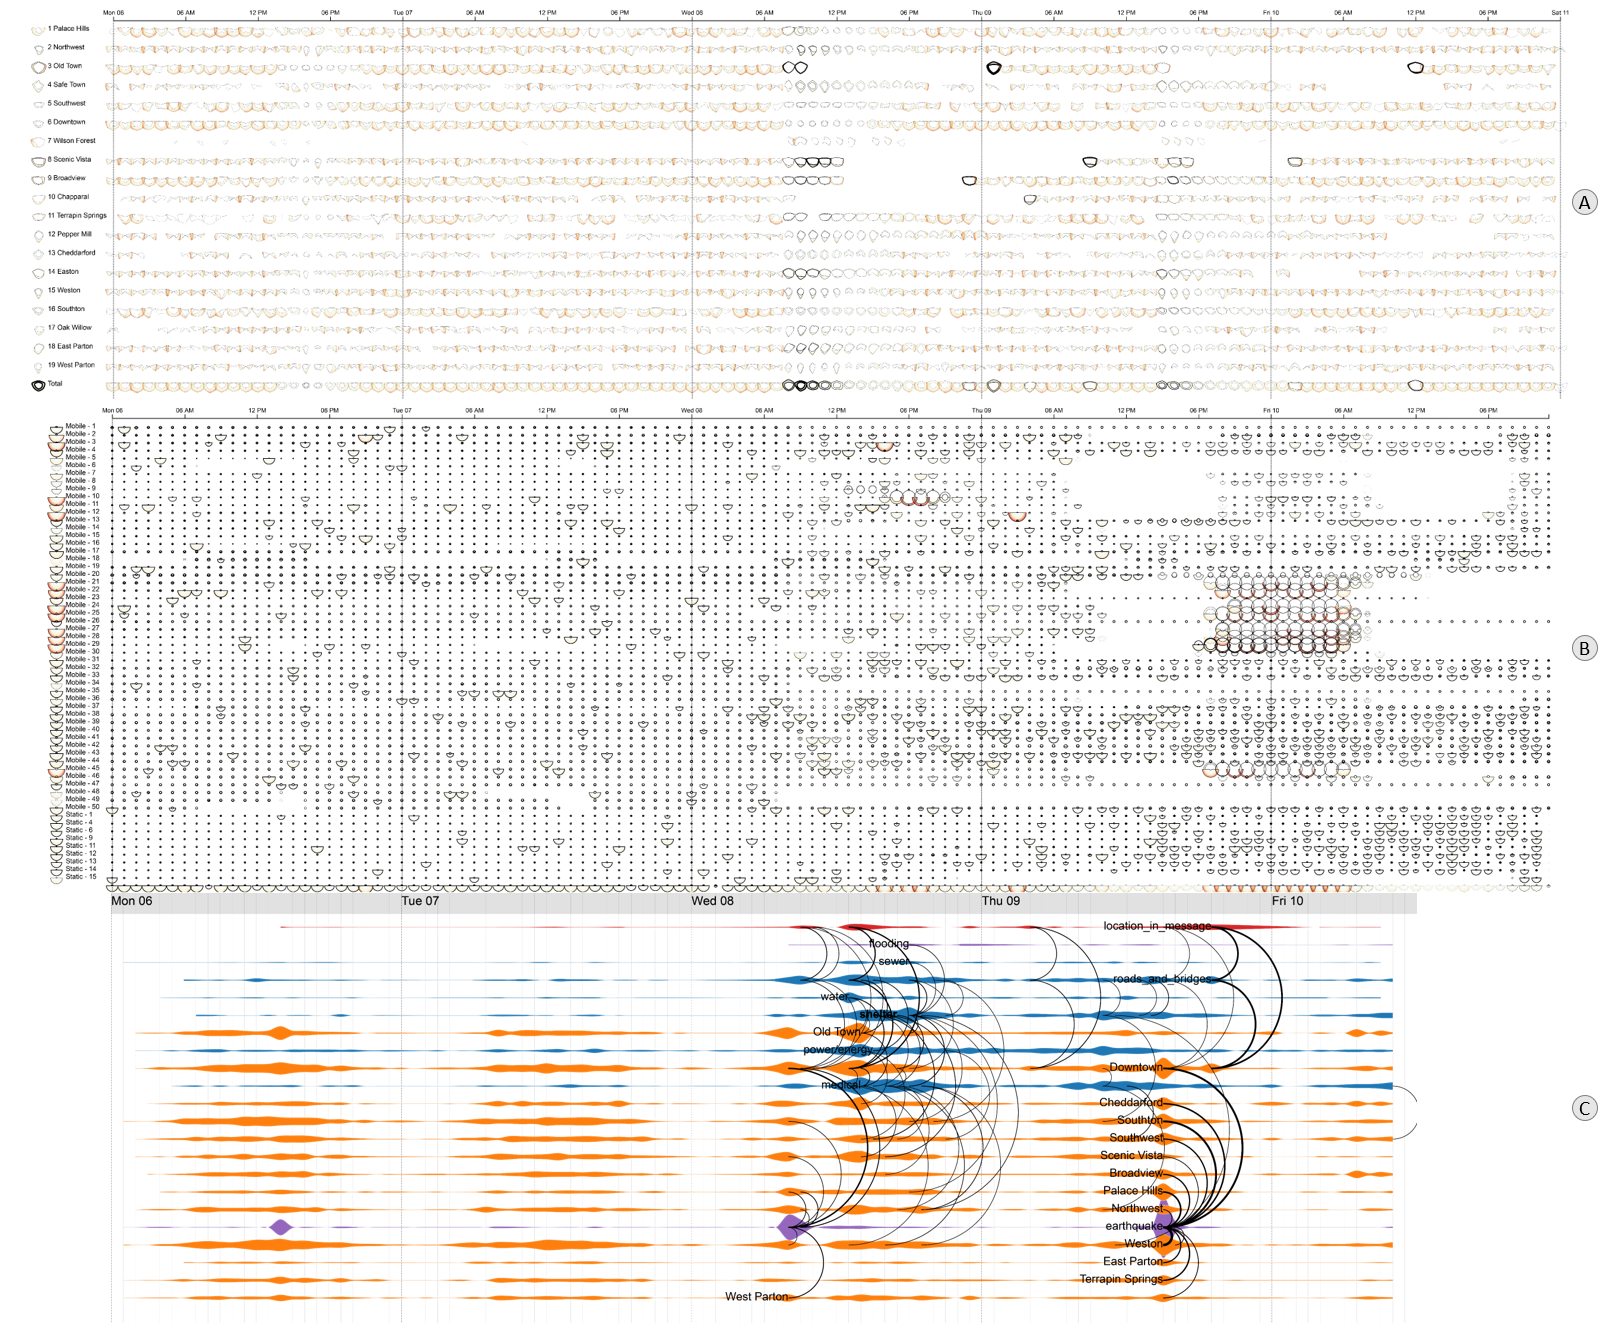
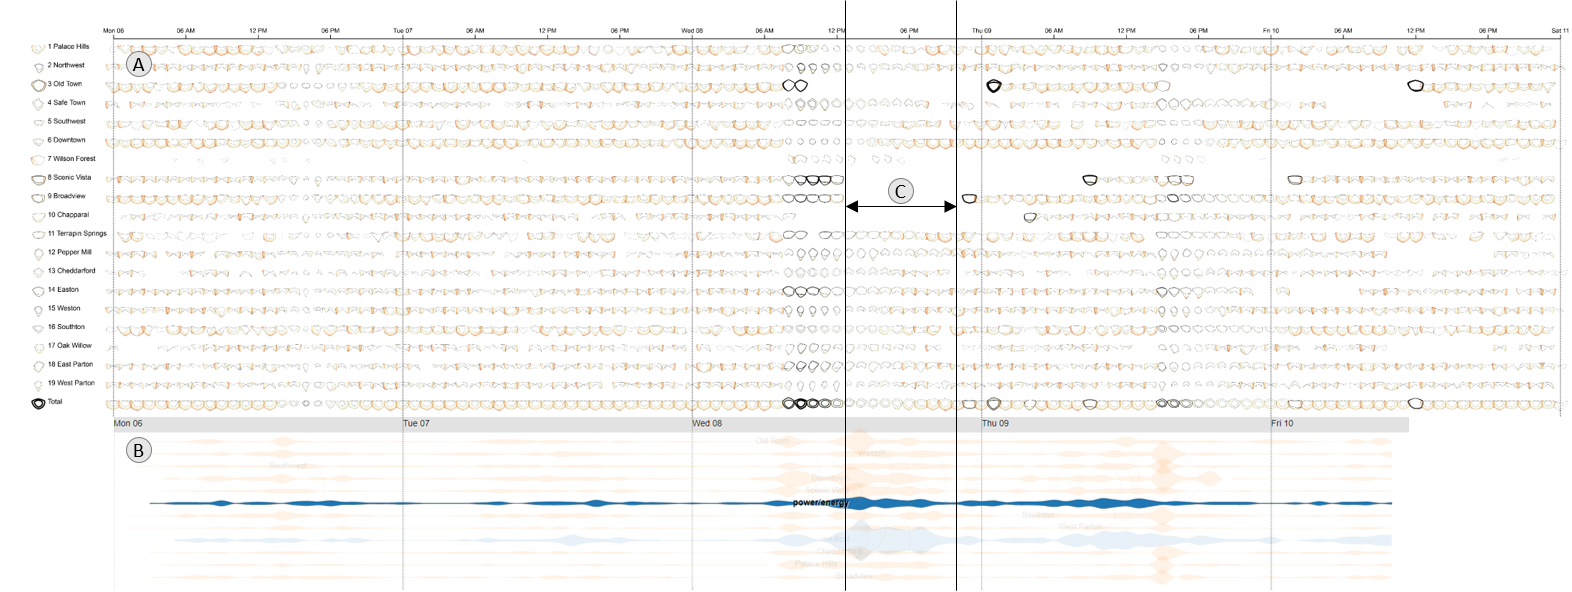
In figure 2, the damaged report (A) is not precise and usually has high uncertainty when the number of report is low or the shake intensity is not defined. In mini-challenge 2 (B), the static sensor is not synchronize with the mobile sensor and not reliable.
The report from Y*nt message (C) has the uncertainty depending to the spam filter and the text analysis technique. However, Y*nt message can be a temporal results for mini-challenge 1 during power off time range.
Questions
2- Identify and explain cases where data from multiple mini-challenges help to resolve uncertainty, and identify cases where data from multiple mini-challenges introduces more uncertainty. Present up to 10 examples. If you find more examples, prioritize those examples that you deem most relevant to emergency response. Limit your response to 1000 words and 12 images.
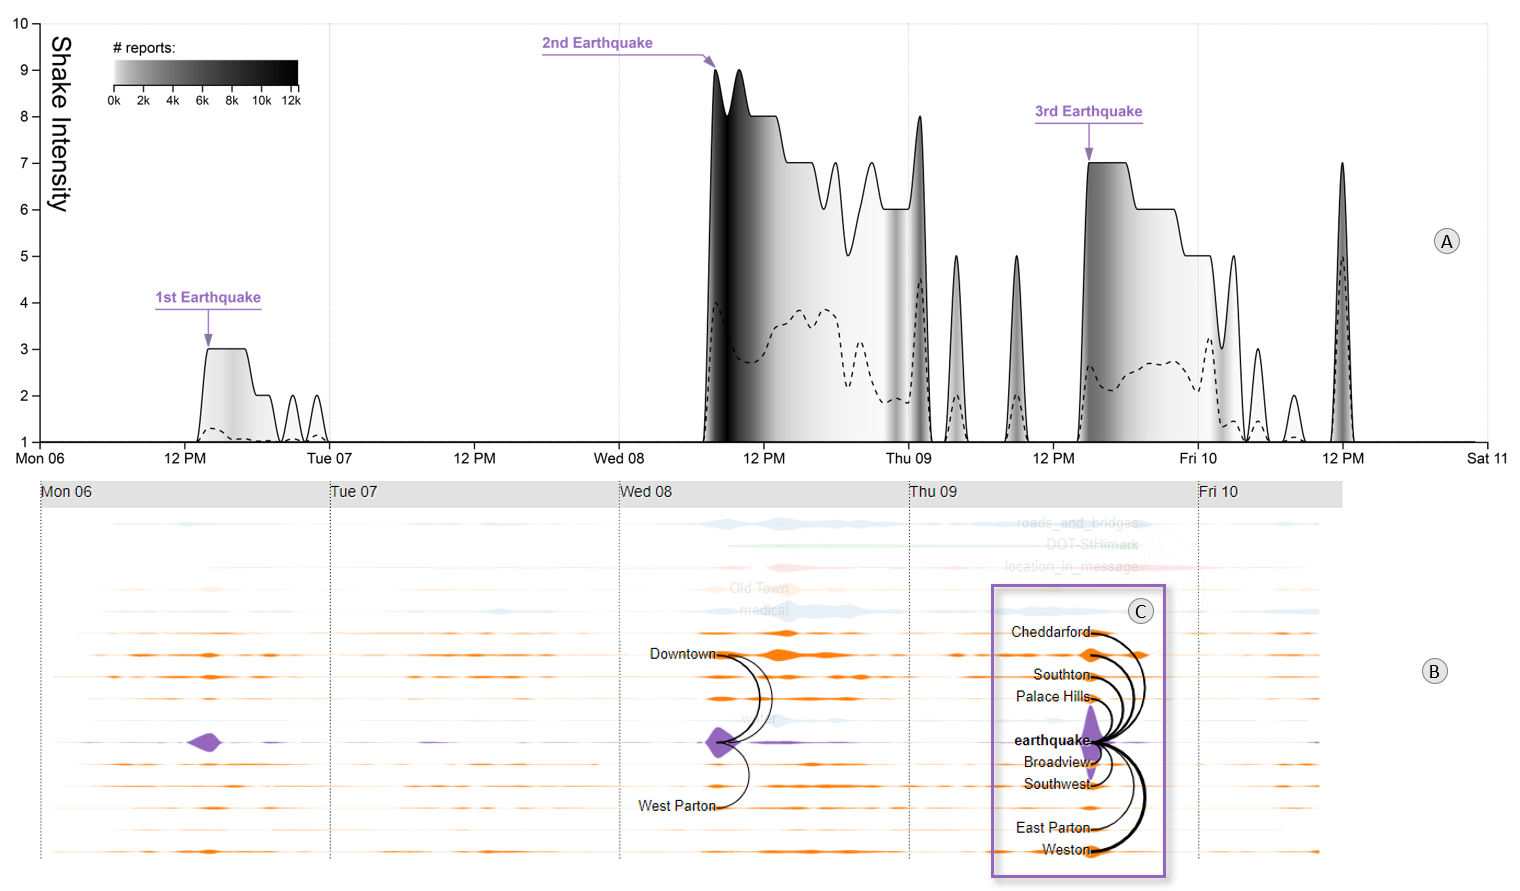
Figure 3. earthquake attention and real damaged report.
The earth quake mentioned in Y*nt application (mini-challenge 3 - Figure 3 (B)) show that the 3rd earthquake get a lot of reports (Figure 3 (C)). However, from the result from Rumble appplication (mini-challenge 1 - Figure 3 (A)) the 3rd earth quake's shake intensity is not highest as the 2nd earthquake.